
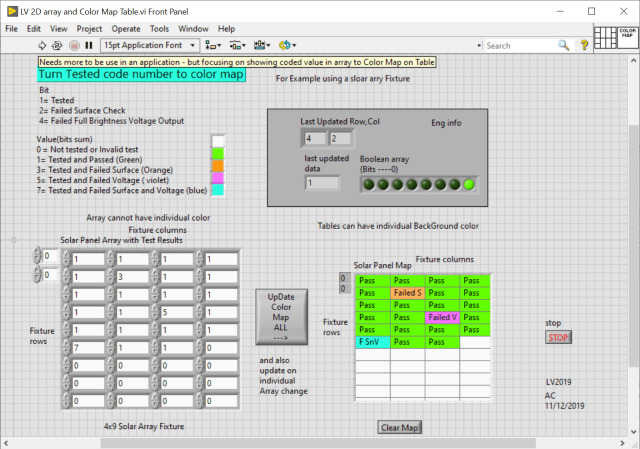
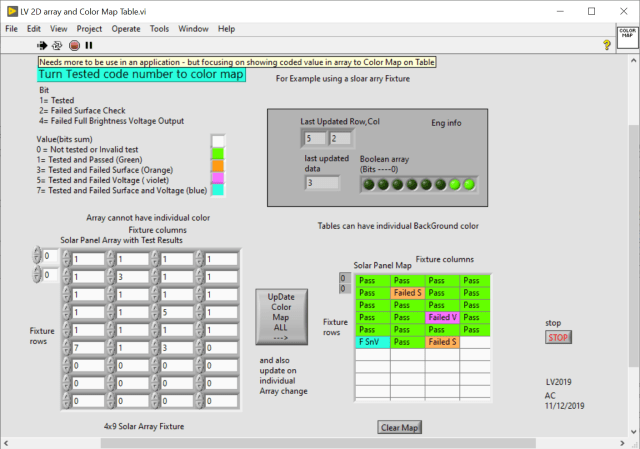
Showing a way to convert 2D array to a color map
Array cannot have individual colors but Table allow individual Back Ground Color
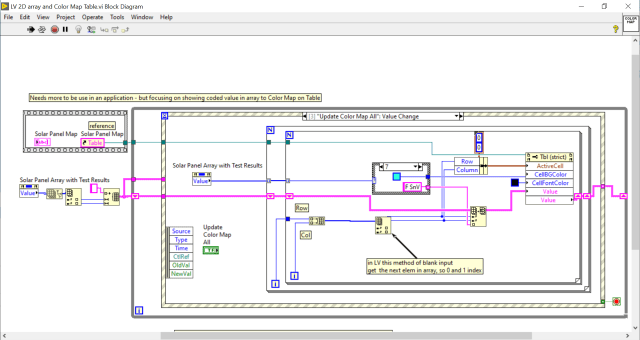
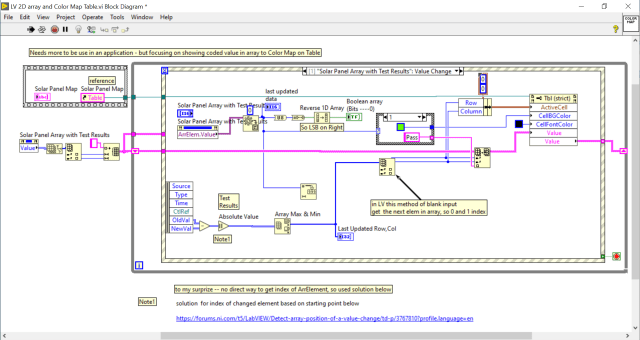
I interesting item is when the Array is changed I can get the Array.Element(its value) but I could not find the updated Element indexs info . However the NI Forum had a solution which is what i need with some changes.
Here is the NI help topic used:
Update All Button
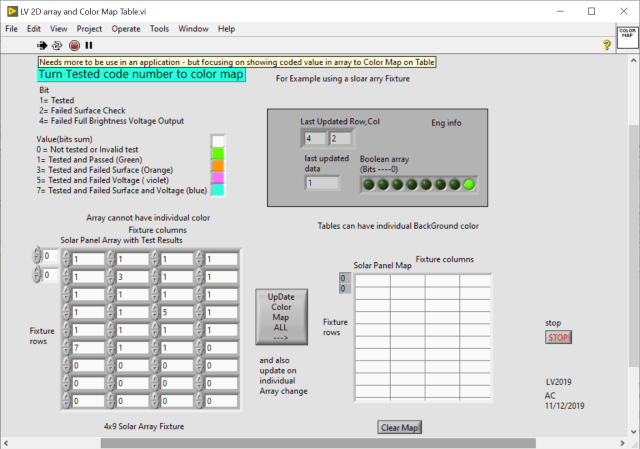
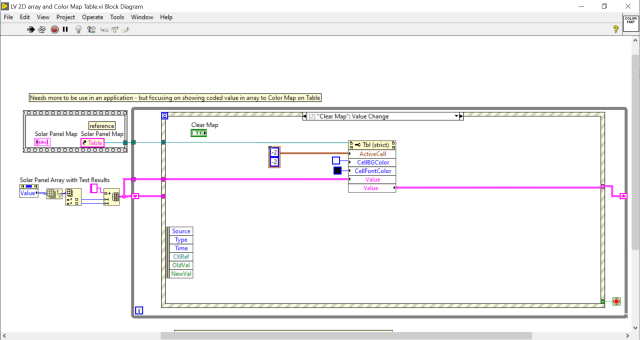
Clear Map button
Change to the number (change value)
LabVIEW® is a National Instrument product
This post is not connected or endorsed by any company.
Created to spark ideas on the subject.
Use at your own risk.
