
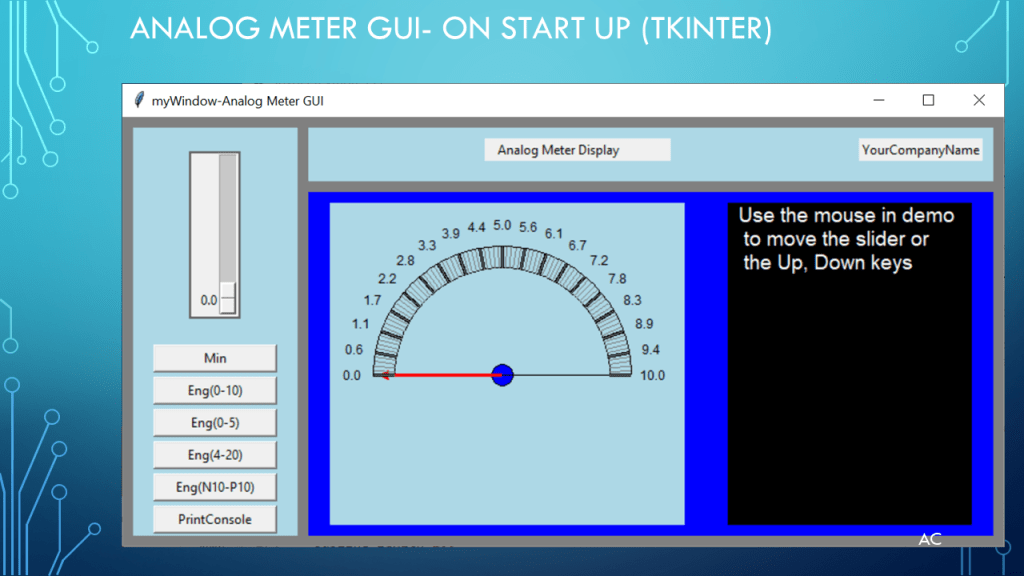
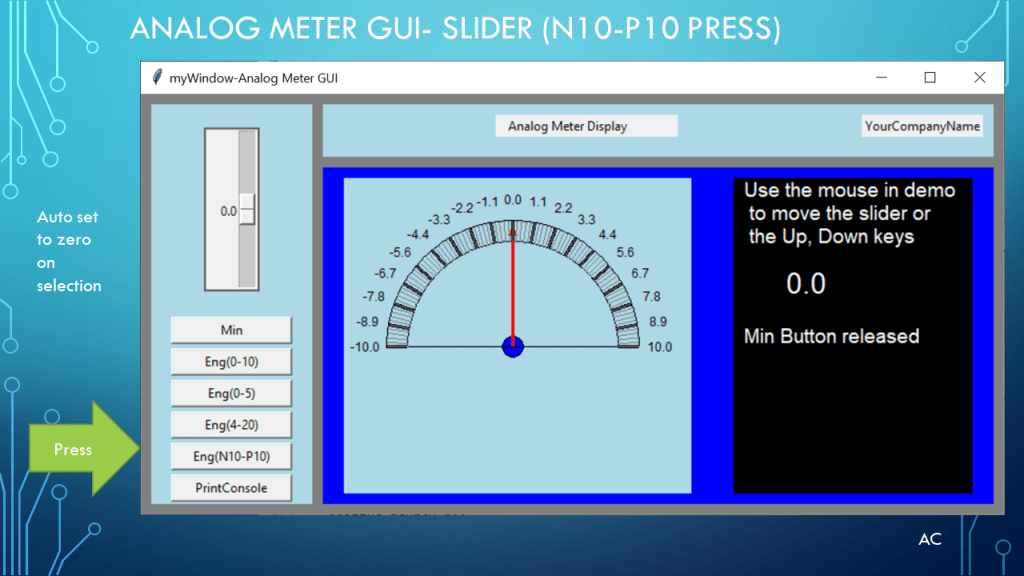
Show use of Python tkinter canvas to create meter and also vertical slider (scale) with binding


Short video of Analog Meter GUI example
Text of Python code
# -*- coding: utf-8 -*-
"""
Created on Sat Apr 8 15:04:12 2023
@author: aleja
Analog Meter GUI and Demo for learning
"""
from tkinter import *
#for some reason from tkinter.ttk import * cause bg lightblue error
from tkinter.ttk import Combobox
import math
import time
#import os #for path filename join
#import threading
#GUI setup below
myWindow=Tk()
myWindow.title("myWindow-Analog Meter GUI")
w_w=820
w_h=400
myWindow.minsize(w_w,w_h)
myWindow.maxsize(w_w,w_h) #if you want to move the operator table to see rest of belt comment out
#next time use resize=false,false
# do this or frame (last frame row number, in window will not follow window (expanding)
myWindow.grid_rowconfigure(0,weight=1) #Important This was the reason for on frame being stuck at bottom was row 0 but 3frames
myWindow.grid_columnconfigure(1,weight=1)
myWindow.configure(background='gray')
MaxDeg=180 #keep dont change for demo, it important for 180 deg display meter
MinDeg=0 #Keep dont change for demo
EngMax=10
EngMin=0
MeterValue=0
def EngNum_to_Deg(EngNum):
M_slope=((MaxDeg-MinDeg)/(EngMax-EngMin))
Deg=M_slope*(EngNum-EngMin)
return Deg
def Deg_to_EngNum(Deg0_180):
M_slope=((EngMax-EngMin)/(MaxDeg-MinDeg))
EngNum=M_slope*(Deg0_180)+EngMin
return EngNum
def Update_Meter(event=None,EventMsg="NoMsg"): # I am a relative novice for this event obj arg , its in my learning curve,it did not hiddern this demo
"""
Description: Update the Meters red pointer \n
Arguments: arg event is tkinter obj when bind events, EventMsg is user string\n
Other: currently Dont know how to use event object directly yet, so using EventMsg in this demo
\nOther: using default None so i can use this function without event also.
"""
global MeterValue
if event==None:
#just a note to remind when a function call was made that as event=None
str_note="reminder,Please note event arg was empty so dont used it"
#print(str_note)
#Update the pointer on the meter
#MeterValue=(MeasNum.get())
MeterValue=MeasNum.get()
#VSlider.set(MeterValue)
Deg=(EngNum_to_Deg(MeterValue))-90
RadDeg=math.radians(Deg)
line_length=115
line_x=line_length * math.sin(RadDeg)
line_y=line_length * math.cos(RadDeg)
canv2.coords(MeterPointer,Center_Dot_x,Center_Dot_y,Center_Dot_x+line_x,Center_Dot_y-line_y)
#canv2.create_line(Center_Dot_x,Center_Dot_y,Center_Dot_x+line_x,Center_Dot_y-line_y,fill='red',width=3,arrow='last')# remember y going up is less
canv3.itemconfigure(Reading_Value,text=str(MeterValue),anchor='w')
canv3.itemconfigure(Event_Label_Info,text=str(EventMsg),anchor='w')
myWindow.update()
#***FRAMES
# adjust r,c,sticky, row and column config as need
frame1=Frame(myWindow,width=120,height=300,bg='lightblue')
frame1.grid(row=0, column=0, sticky='NSWE', padx=10, pady=10, columnspan=1,rowspan=2)
frame1.rowconfigure(0,weight=1)
frame1.columnconfigure(0,weight=0) #the lastcol goes along with rigth side expanding
#frame2 Right
# adjust r,c,sticky, row and column config as need
frame2=Frame(myWindow,width=300,height=300,bg='blue')
frame2.grid(row=1, column=1, sticky='NESW', padx=(0,10), pady=(0,10), columnspan=1) #padding ALSO takes two arguments tuple
frame2.rowconfigure(0,weight=1)
frame2.columnconfigure(1,weight=1) #the lastcol goes along with rigth side expanding
#Top frame
frame3=Frame(myWindow,width=100,height=100,bg='lightblue')
frame3.grid(row=0, column=1, sticky='NESW', padx=(0,10), pady=10, columnspan=1) #padding ALSO takes two arguments tuple
frame3.rowconfigure(1,weight=0)
frame3.columnconfigure(1,weight=1) #the lastcol goes along with rigth side expanding
#frame3 info
AppTitleLabel=Label(frame3, text=" Analog Meter Display ")
CompanyName=Label(frame3, text="YourCompanyName")
AppTitleLabel.grid(row=0, column=0, padx=0, pady=10, columnspan=2) #span 2 so it does not affect component button
CompanyName.grid(row=0, column=3, padx=10, sticky='E') #Keep
# ===============Meter_Info =================
Meter_Width=300
Meter_Height=300
#Meter Povit Point Center Dot
Dot_Padding=10
Center_Dot_x=Meter_Width/2+Dot_Padding
Center_Dot_y=Meter_Height/2+Dot_Padding
Center_Dot_radius=10
canv2=Canvas(frame2,width=Meter_Width+30, height=Meter_Height, bg='lightblue', bd=0, highlightthickness=0)
canv2.grid(row=0, column=0, columnspan=1,padx=20,pady=10)
canv2.create_oval(Center_Dot_x-Center_Dot_radius,Center_Dot_y-Center_Dot_radius,\
Center_Dot_x+Center_Dot_radius,Center_Dot_y+Center_Dot_radius,fill='blue')
#=== Two Arc for Major and Minor tick marks
arcx=Center_Dot_x
arcy=Center_Dot_y
arc_circle_radius=100
coord_arc=(arcx-arc_circle_radius,arcx-arc_circle_radius,\
arcx+arc_circle_radius,arcx+arc_circle_radius)
arc_startDeg=0
arc_endDeg=180
canv2.create_arc(coord_arc,start=arc_startDeg,extent=arc_endDeg)
arc_circle_radius=120
coord_arc=(arcx-arc_circle_radius,arcx-arc_circle_radius,\
arcx+arc_circle_radius,arcx+arc_circle_radius)
canv2.create_arc(coord_arc,start=arc_startDeg,extent=arc_endDeg)
#=== create first starting Meter Pointer red arrow line
MeterValue=0 #unscale 0-180
Deg=MeterValue-90
RadDeg=math.radians(Deg)
line_length=115
line_x=line_length * math.sin(RadDeg)
line_y=line_length * math.cos(RadDeg)
MeterPointer=canv2.create_line(Center_Dot_x,Center_Dot_y,Center_Dot_x+line_x,Center_Dot_y-line_y,fill='red',width=3,arrow='last')# remember y going up is less
scale_Top=180
scale_Bottom=0
#binding keys and mouse
#=== Veritical Slider used to change Meter Pointer (reading) ===============================
MeasNum=DoubleVar()
VSlider=Scale(frame1,from_=EngMax, to=EngMin,length=150,variable=MeasNum,digits=3,resolution=0.1)
VSlider.grid(row=0,column=0) #dont forget the odd underscore on from
#Becasue the slider would generate tons of event using release and I DONT KNOW how have ,not found ScaleChanged event
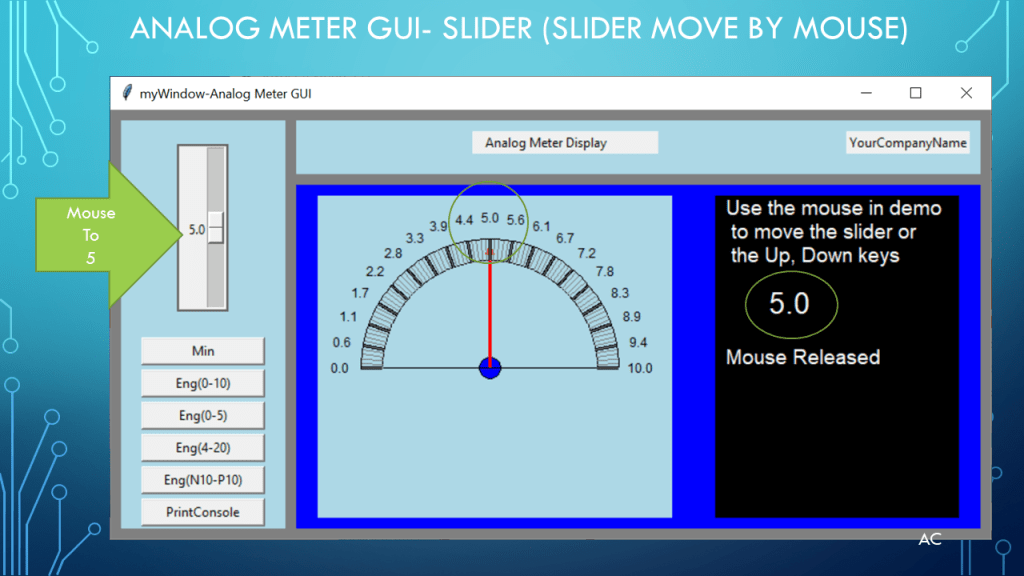
VSlider.bind('<ButtonRelease-1>',lambda event: Update_Meter(event,"Mouse Released"))
#important <Up> is not equal to <KeyRelease-Up> Up only was causing a missing event that cause a one resolution offset
VSlider.bind('<KeyRelease-Up>',lambda event: Update_Meter(event,"Up key Pressed")) #just using UP will give on missing event which cause odd 0.1 offest
VSlider.bind('<KeyRelease-Down>',lambda event: Update_Meter(event,"Down key Pressed"))
#Not working this way VSlider.bind('<ButtonRelease-1>,<Up>,<Down>',Update_Meter)
VSlider.focus_set() #focus is important
frame1.focus_force() #focus is important for demo so the frame will listen to the up and down keys both the keypad, and keyboard area
#interesting ctrl and up key moved it in big steps, not the shift key the ctrl key
#======= Majore and Minor ====== Tick markers
#major line
for iDeg in range(-90,91,10): #because of axis 0-180 = -90 to 90
RadDeg=math.radians(iDeg)
subline_length=100
subline_x1=subline_length * math.sin(RadDeg)
subline_y1=subline_length * math.cos(RadDeg)
subline_length=120
subline_x2=subline_length * math.sin(RadDeg)
subline_y2=subline_length * math.cos(RadDeg)
canv2.create_line(Center_Dot_x+subline_x1,Center_Dot_y-subline_y1,\
Center_Dot_x+subline_x2,Center_Dot_y-subline_y2,fill='black',width=3)# remember y going up is less
#minor line
for iDeg in range(-90,91,2):
RadDeg=math.radians(iDeg)
subline_length=100
subline_x1=subline_length * math.sin(RadDeg)
subline_y1=subline_length * math.cos(RadDeg)
subline_length=120
subline_x2=subline_length * math.sin(RadDeg)
subline_y2=subline_length * math.cos(RadDeg)
canv2.create_line(Center_Dot_x+subline_x1,Center_Dot_y-subline_y1,\
Center_Dot_x+subline_x2,Center_Dot_y-subline_y2,fill='gray',width=1)# remember y going up is less
Meter_Text_Canv_List=[]
def Update_Meter_MajorText():
global Meter_Text_Canv_List
"""
Updates the Meters Major Text Number
"""
#Number text on Major ticks
MeterNumMajor=0
for iDeg in range(-90,91,10):
MeterNumMajor=Deg_to_EngNum(iDeg+90)
RadDeg=math.radians(iDeg)
Text_Radius_Loc=140
Text_x1=Text_Radius_Loc * math.sin(RadDeg)
Text_y1=Text_Radius_Loc * math.cos(RadDeg)
M_T_C=canv2.create_text(Center_Dot_x+Text_x1,Center_Dot_y-Text_y1,fill="black",text=round(MeterNumMajor,1),font=('Arial',9,''))
Meter_Text_Canv_List.append(M_T_C)
MeterNumMajor=MeterNumMajor+10
Update_Meter_MajorText()
#=== Canvas 3
# canv3 side info on Right
canv3=Canvas(frame2,width=Meter_Width, height=Meter_Height, bg='black', bd=0, highlightthickness=0)
canv3.grid(row=0, column=1, columnspan=1,padx=20,pady=10)
#some info on right side convas - Reading will get a value when updating vertical slider(called scale in python)
Info_Label=canv3.create_text(10,0,fill="white",text="Use the mouse in demo \n to move the slider or \n the Up, Down keys",anchor='nw',font=('Arial',14,''))
Reading_Value=canv3.create_text(50,100,fill="white",text="",font=('Arial',20,''),anchor="center")
Event_Label_Info=canv3.create_text(10,150,fill="white",text="",font=('Arial',14,''))
def Zero_Slider():
VSlider.focus_force
if (EngMin<0):
MeasNum.set(0)
else:
MeasNum.set(EngMin)
Update_Meter(None,"Min/Zero Button released") #warning not using event arg or in function
return
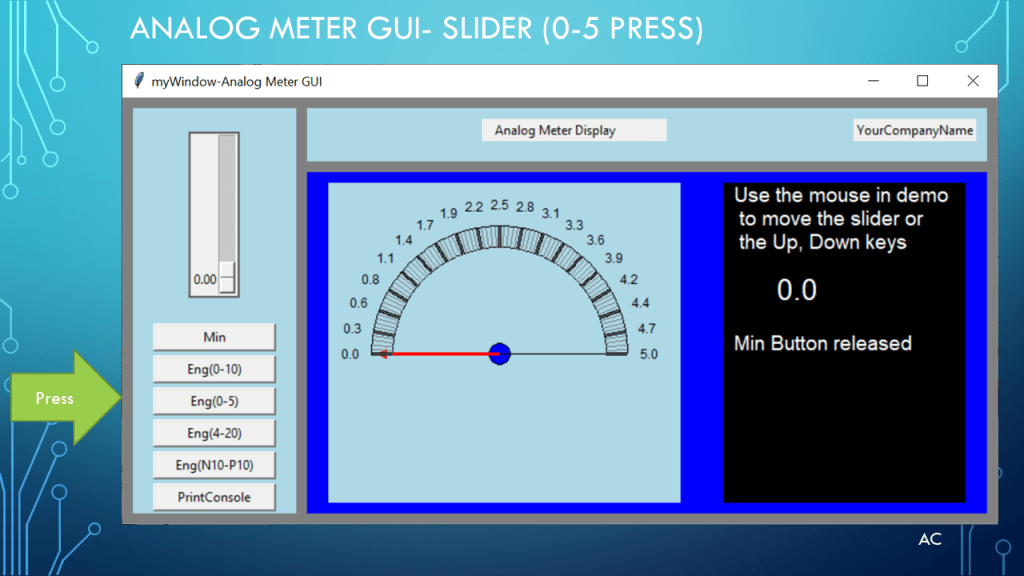
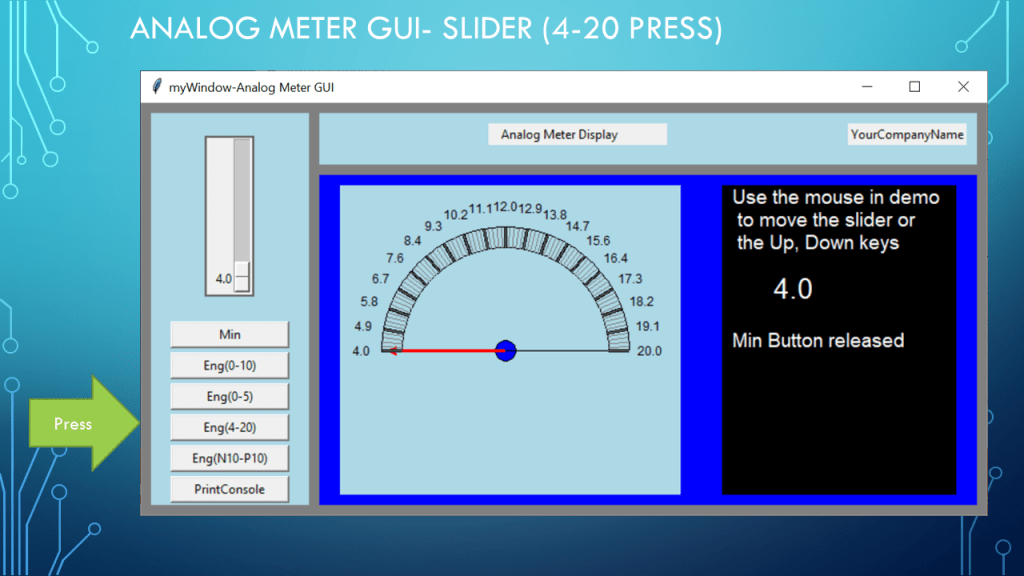
def Meter_and_Slider_Update(Emin=0,Emax=10):
global Meter_Text_Canv_List
global EngMax
global EngMin
EngMax=Emax
EngMin=Emin
#first delete current text
for M_T_C_item in Meter_Text_Canv_List:
canv2.delete(M_T_C_item)
Update_Meter_MajorText()
VSlider.configure(from_=EngMax,to=EngMin)
VSlider.focus_force
if(EngMin<0):
VSlider.set(0)
MeasNum.set(0)
else:
VSlider.set(EngMin)
MeasNum.set(EngMin)
Update_Meter(None,"Min Button released") #warning not using event arg or in function
return
def PrintConsole():
print(MeterValue,MeasNum.get(),VSlider.get())
VSlider.set(MeterValue)
Zero_VSlider_Btn=Button(frame1, text='Min',width=15, command=lambda:Zero_Slider())
Zero_VSlider_Btn.grid(row=1, column=0,padx=19,pady=2)
Zero_to_10_Btn=Button(frame1, text='Eng(0-10)',width=15, command=lambda:Meter_and_Slider_Update(0,10))
Zero_to_10_Btn.grid(row=2, column=0,padx=10,pady=2)
Zero_to_5_Btn=Button(frame1, text='Eng(0-5)',width=15, command=lambda:Meter_and_Slider_Update(0,5))
Zero_to_5_Btn.grid(row=3, column=0,padx=10,pady=2)
Four_to_20_Btn=Button(frame1, text='Eng(4-20)',width=15, command=lambda:Meter_and_Slider_Update(4,20))
Four_to_20_Btn.grid(row=4, column=0,padx=10,pady=2)
N10_to_P10_Btn=Button(frame1, text='Eng(N10-P10)',width=15, command=lambda:Meter_and_Slider_Update(-10,10))
N10_to_P10_Btn.grid(row=5, column=0,padx=10,pady=2)
PrintConsole_Btn=Button(frame1, text='PrintConsole',width=15, command=lambda:PrintConsole())
PrintConsole_Btn.grid(row=6, column=0,padx=10,pady=2)
#main Window GUI looping
myWindow.mainloop()
Download for code
Notes
- Presentation: Analog Meter Display GUI using Vertical slider for input to meter, show different scale changes
- Programming Language used: Python 3.7 in Spyder
- Presentation app: Microsoft’s PowerPoint
- Python and Tkinter are products of respective company
- Presentation shown to spark ideas of use.
- This presentation is not connected to or endorsed by any company.
- Use at your own risk.
- Tags: Python, Python3.7, Tkinter , Canvas ,GUI, List, Dictionary, StringVar,Calling, Event binding , Default None for Event, Key and Mosue binding, KeyRelease-Up, KeyRelease-Down
