Python – Sklearn – Chi- Categorical Ordinal

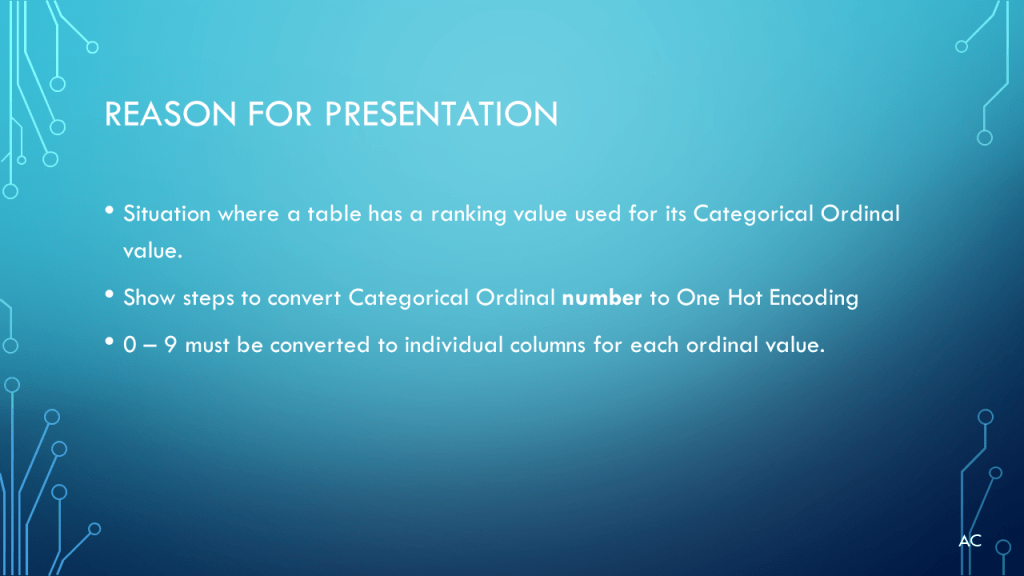
Presentation on Chi2 with a categorical ordinal ranking (0-9) and a Categorical-Binary Target

Presentation

Code

Code (case 3 is enabled others commented out)

# -*- coding: utf-8 -*-
"""
Created on Sat Jan 20 16:23:59 2024

@author: aleja

A table with categorical ranking(num) and target categ binary
Need to change cat rank(num) to cat nominal
"""

import numpy as np
from sklearn.feature_selection import chi2
import pandas as pd

#let make the randomness repeatable for presentation
np.random.seed(123)
num_of_rows=1000
#x data 0..9 represent ranking of some kind
array = np.random.randint(0, 10, size=(num_of_rows, 3))
print(array)
#Target binary int 0,1 so cat nominal

#=== >comment out< the target case change you dont want
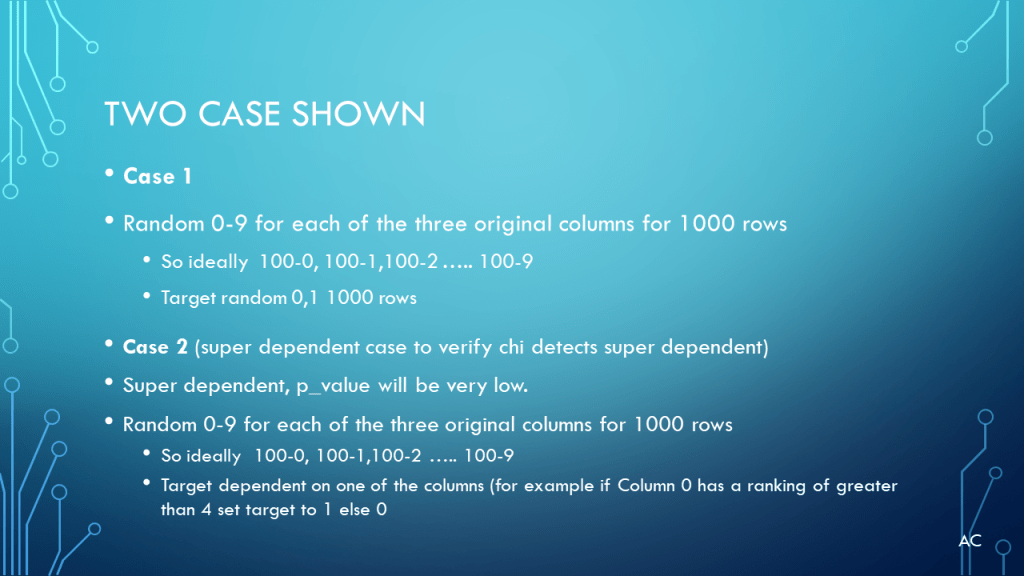
#Case1:first random all random
#Target = np.random.randint(0, 2,size=(num_of_rows, 1))

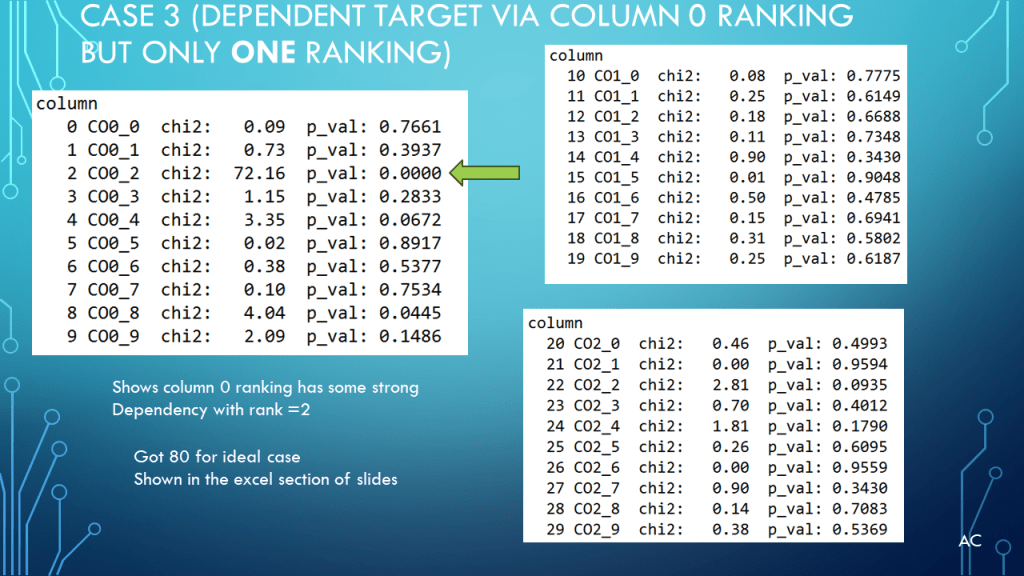
#Case3:force dependency on ONE value ranking in col0 all other random
Target =np.where(array[:,0]==2,1,(np.random.randint(0, 2,size=array[:,0].shape)))
#another way but you need to keep case 1 ,Target[array[:,0]==2] = 1

#Case2:now i what to force a column0 to be totally affecting the target to verify chi2 is working, should be 100 check ranking
#Target[:,0] =np.where(array[:,0]>4,1,0)


#add Target to the array
array = np.column_stack((array, Target))

#turn into dataframe
my_col_hdr=['Cat_ord0','Cat_ord1','Cat_ord2','Target']
df=pd.DataFrame(array,columns=my_col_hdr)
print(df)


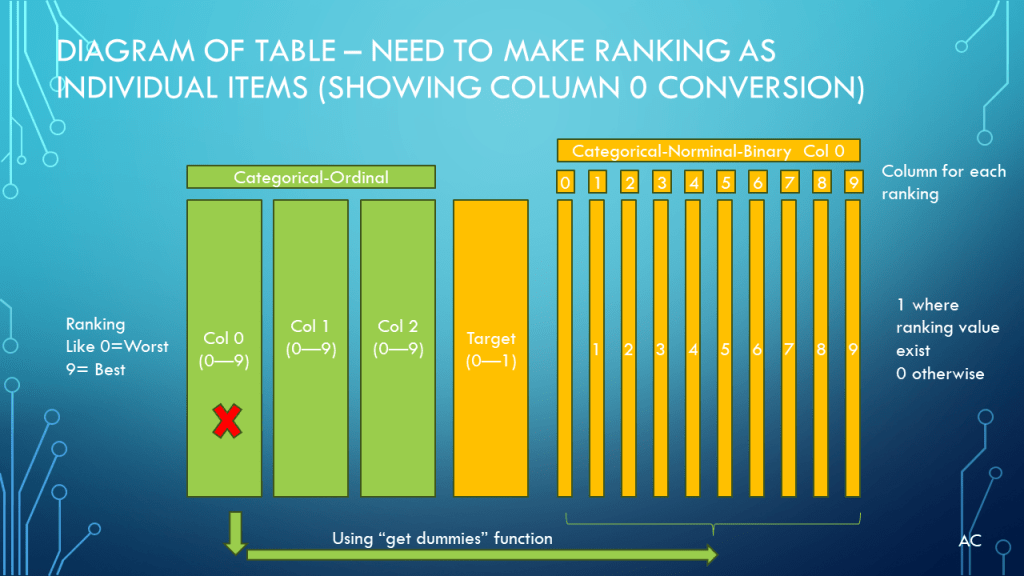
#yes the get_dummies understands number ranking just help it with what column
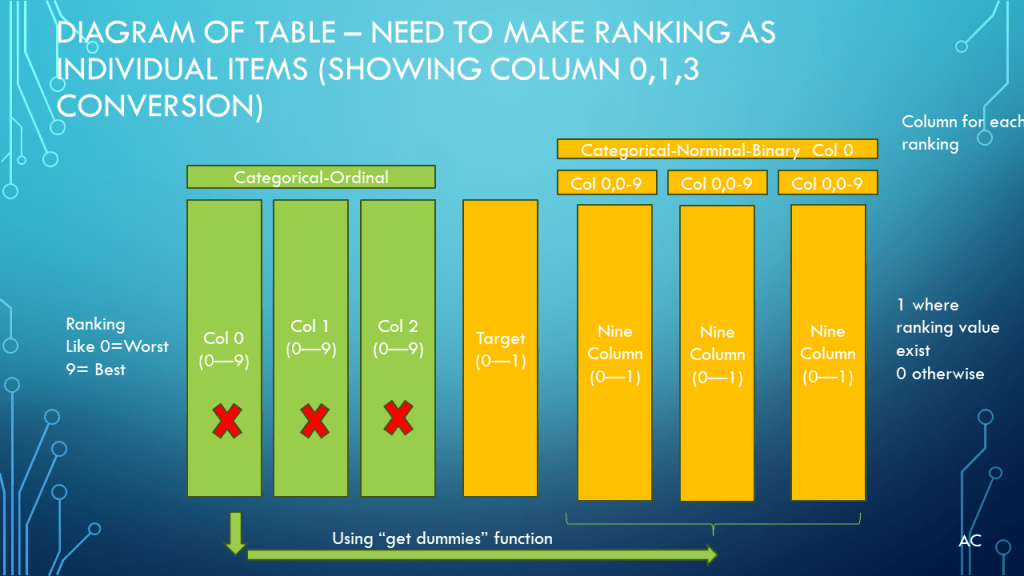
df = pd.get_dummies(df,columns=['Cat_ord0'],prefix='CO0',dtype='int8')
df = pd.get_dummies(df,columns=['Cat_ord1'],prefix='CO1',dtype='int8')
df = pd.get_dummies(df,columns=['Cat_ord2'],prefix='CO2',dtype='int8')

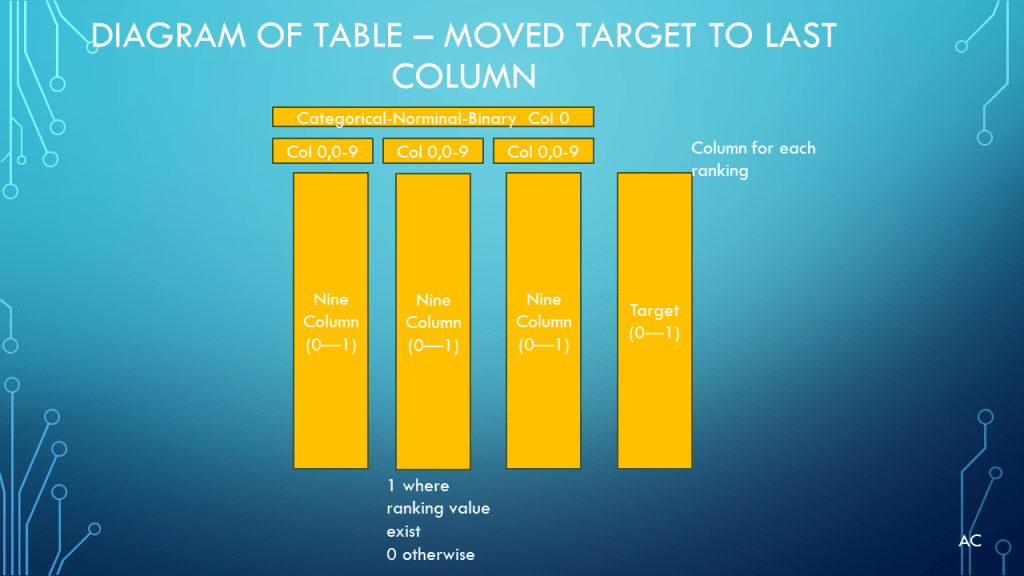
#move target column to end, seems traditional to do so.
#all the dummies removed the original column which made target the first column
col_to_end=df.columns[0]

df=df[[c for c in df if c != col_to_end] + [col_to_end]]
print(df)

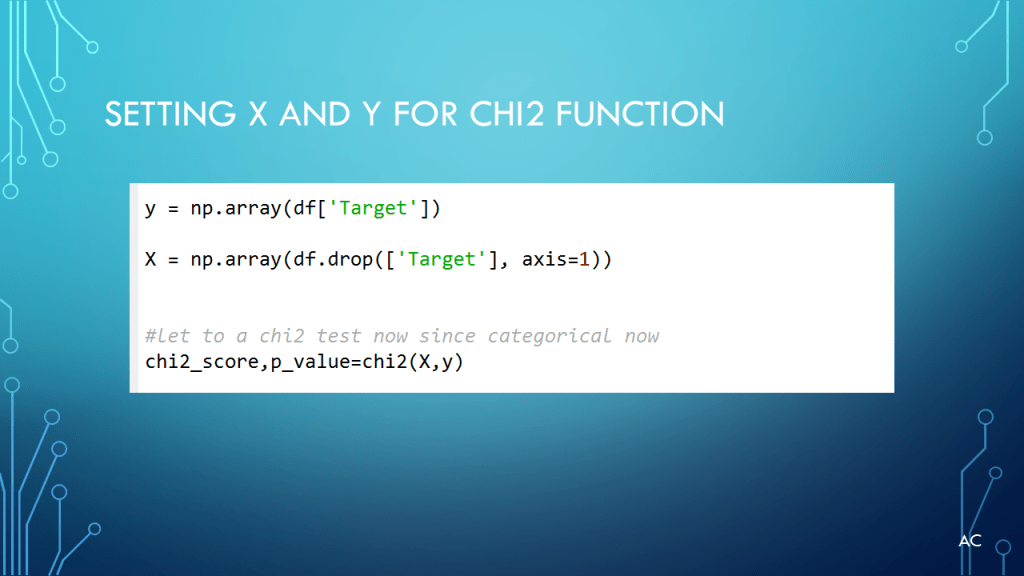
y = np.array(df['Target'])

X = np.array(df.drop(['Target'], axis=1))


#let to a chi2 test now since categorical now
chi2_score,p_value=chi2(X,y)

# want to see it vertical form
for i,col_name in enumerate(df.columns[:-1]):
    if i%10==0: print("column")
    print("%4.0f"%i,col_name," chi2:","%6.2f" % chi2_score[i]," p_val:","%0.4f" % p_value[i])
    if i%10==9: print("\n")

Notes

  • Presentation: Using Python and Sklearn Chi2 with a created ranking Categorical data and using get-dummies to convert to Categorical Binary Columns for Chi2 processing.
  • Presentation Title:Python-ChI2-Categorical ordinal-number Ranking
  • Programming Language used: Python 3.11.3 in Spyder5.4.3, Presentation app: Microsoft’s PowerPoint
  • Helpful resource: Stackoverflow, Search Engines , Chat AIs, and Python communities.
  • Python, SkLearn,Pandas ,Stackoverflow, Numpy are from respective companies.
  • Presentation shown to spark ideas of use.
  • This presentation is not connected to or endorsed by any company.
  • Use at your own risk.
  • Tags: Python, Python3.11, SkLearn, Chi2 , get-dummies, Pandas, Numpy, array
  • Other Info: Chi2 is typically used for feature selection when dealing with categorical type data (=what columns are most important)
Posted in Test Sector | Tagged , , , , | Leave a comment

Python – FTT – with Scipy

Python FFT or Sinewave with two components using Scipy-FFT

Show result in plots using Matplotlib(r) library

Starting point was from a Chat AI which did not put the import Matplotlib

Modification added to get plots and limit frequency span.

Also limited frequency components via a threshold value on relative amplitude.

Presentation

Code

# -*- coding: utf-8 -*-
"""
Created on Wed Nov 29 07:38:05 2023

@author: aleja
"""
#Testing G-AI created code
#added modifications
 
import numpy as np
import matplotlib.pyplot as plt #added was missing
import scipy.fft as fft

# Create a sine wave
freq=10
resolution=0.001
t = np.arange(0, freq, resolution)
#freq and 10xfreq
y = 4.0*np.sin(2.0 * np.pi * t)+2.0*np.sin(2.0 * np.pi * 10.0*t)
print("number of points:",freq/resolution)
print (np.max(y))
print (np.min(y))
# Calculate the fft
yf = fft.fft(y)
yfa=np.abs(yf)/np.max(np.abs(yf)) #relative amplitude
yfa=yfa[0:1000]

threshold_of_yffamp=0.2
indexs=np.where(yfa>threshold_of_yffamp) #remember indexs[0] holds the tuples

#convert indexs tuple to list
list_indexs=list(indexs[0])
print("==============")
print("freq,rel-amp")
for index in list_indexs:
    print (index,",",yfa[index]) 
print("==============")

#limit freq range
freq_range=np.max(indexs)*2
# Plot the fft
plt.close('all')
fig, [plt1,plt2] = plt.subplots(nrows=2, ncols=1)
plt1.plot(t,y,"b.")
plt1.set_xlabel("period")
plt1.set_ylabel("amplitude")
plt1.set_title("Sample data-fictional")


plt2.set_xlim(0,freq_range) #limit x axis freq range
plt2.plot(np.abs(yfa),"r-")
plt2.set_xlabel("freq")
plt2.set_ylabel("relative amp")
plt2.set_title("FFT")
for n in list_indexs:
 plt_text=(str(yfa[n])+","+ str(n))
 plt2.text(n,yfa[n],plt_text)

plt.get_current_fig_manager().window.setGeometry(10,50,1000,500)
plt.tight_layout()

plt.show

Code

Notes

  • Presentation: Testing FTT module from Scipy on two component sinewave
  • Programming Language used: Python 3.11.3 in Spyder5.4.3,Matplotlib 3.7.2
  • Presentation app: Microsoft’s PowerPoint
  • Helpful resource: Stackoverflow, Search Engines , Chat AI, and Python communities.
  • Python, Tkinter, Matplotlib, Scipy are products of respective companies
  • Presentation shown to spark ideas of use.
  • This presentation is not connected to or endorsed by any company.
  • Use at your own risk.
  • Tags: Python, Python3.11, numpy Matplotlib , Scipy, FFT, List, Sinewave, np.where.
Posted in Test Sector | Tagged , , , , , | Leave a comment

Sinewave Fit via Python with SciPy

Testing a sinewave fit code provide by Chat AI with different conditions.

Original Posted Date: Nov 22, 2023

Presentation

Code

# -*- coding: utf-8 -*-
"""
Created on Tue Oct 31 06:38:35 2023

@author: aleja
"""

#Testing out code form Bing Chat as starting point
#some modification added for clarity,and testing

# Generate some sample data
import numpy as np
import matplotlib.pyplot as plt

N = 20 # number of data points
amp = 2.0 # amplitude of the sinewave
freq = 0.2 # frequency of the sinewave
phase = np.pi / 4 # phase of the sinewave
offset = 1.0 # offset of the sinewave
noise = 0.01 # noise level  reduce from chat was 0.5 to see lest noise at first

#number of cycle freq * max x
# Create the x and y values
x = np.linspace(0,10, N)  #changing this to test how strong this leastsq fit is
y = amp * np.sin(2 * np.pi * freq * x + phase) + offset
y += noise * np.random.randn(N) # add some noise

# Plot the data
plt.scatter(x, y)
plt.xlabel("x-voltage")
plt.ylabel("y-optical detector")
plt.title("Sample data-fictional")
plt.show()


#Next Fit testing out chat code
# Fit a sinewave using least squares optimization
from scipy.optimize import leastsq

# Define the sinewave function
def sin_func(p, x):
    A, f, p, c = p # unpack the parameters
    return A * np.sin(2 * np.pi * f * x + p) + c

# Define the error function to minimize
def error_func(p, x, y):
    return y - sin_func(p, x)

# Make some initial guesses for the parameters
p0 = [amp, freq, phase, offset]

# Optimize the parameters using least squares
p_opt, p_cov = leastsq(error_func, p0, args=(x,y))

X = np.linspace(0, 10, N*10) #new x for better visual of sinewave
# Predict the y values using the optimized parameters
y_pred = sin_func(p_opt,X)

# Plot the inputdata(blue dots) and predicted curves(red line)
plt.plot(x,y,"b.",label="data")

plt.plot(X,y_pred,"r-",label="prediction")
plt.xlabel("x-voltage")
plt.ylabel("y-optical detector")
plt.title("Sinewave fitting using least squares-not real product data")
plt.legend()
plt.show()

#added print for simulation info
print("Simulated Paramters:")
print(f"Number of Points: {N}")
print(f"Number of cycles {freq*np.max(x):.1f}")
print(f"Amplitude: {amp:.3f}")
print(f"Frequency: {freq:.3f}")
print(f"Phase: {phase:.3f}")
print(f"Offset: {offset:.3f}")
print(f"Noise: {noise:.3f}")
print("\n")

# Print the optimized parameters
print("Fit Parameters:")
print(f"Amplitude: {p_opt[0]:.3f}")
print(f"Frequency: {p_opt[1]:.3f}")
print(f"Phase: {p_opt[2]:.3f}")
print(f"Offset: {p_opt[3]:.3f}")

#added comments below not part of Chat info
#summary: Chat created code was workable, added print to compare sim and fit
#opinion: does a good job at fitting sinewave ...see presentation
#opinion: best when provide with more points over cycle (most know this)
#see blog presentation at www.testengineerresource.com
#Environment used: python 3.11.3 and worked in Spyder IDE 5.4.3 (conda), mathplotlib 3.7.1
#Environment info: I have plot show in own window (not in Spyder)
#Plots are not clear to allow for testing of overlap sinewave fit.

#getting version info
#import matplotlib
#print ('matplotlib: {}'.format (matplotlib.__version__))

Notes

  • Presentation: Testing a Chat AI provide Sinewave fit code
  • Programming Language used: Python 3.11.3 in Spyder5.4.3,Matplotlib 3.7.2
  • Presentation app: Microsoft’s PowerPoint
  • Helpful resource: Stackoverflow, Search Engines , Bing chat AI, and Python communities.
  • Bing and “Bing Chat” are Microsoft’s product.
  • Python, Tkinter, Matplotlib, Scipy are products of respective companies
  • Presentation shown to spark ideas of use.
  • This presentation is not connected to or endorsed by any company.
  • Use at your own risk.
  • Tags: Python, Python3.11, Tkinter , Matplotlib , Scipy, LeastSq, List, Sinewave fit , scipy (optimize)
Posted in Test Sector | Tagged , , , , , | Leave a comment

LV Slider with multiple slides and custom pointer

Presentation

Short Video (27sec)

LV code zip

Notes

Notes

  • Presentation: Slider with extra slides and custom pointer
  • Programming Language used: LabVIEW® 2019 Base version
  • LabVIEW® is a NI (formally National Instruments) products
  • Presentation app: Microsoft’s PowerPoint
  • Custom Slider pointer Hi and Lo made with app: Microsoft’s 3D Paint using transparent canvas.
  • Presentation shown to spark ideas of use.
  • This presentation is not connected to or endorsed by any company.
  • Use at your own risk.
  • Tags: LabVIEW® , LV2019,Slider, Customize Slider, Slider Properties
  • Original Content Location: https://testengineerresource.com
Posted in Test Sector | Tagged , , , , | Leave a comment

LV Sequence Editor Creator Example

Presentation on a simple example of Sequence Editor /Creator using an NI LabVIEW project template as a starting point.

Originally Published Mar 7,2023

updated 9/6/2023 Added Right click on Add PS1,2 for parameter, AutoScroll when Sequence list is longer then visual, added clear Sequence list. Adding short about 1min video

updated 9/6/2023 Added LV code.

Presentation

New Images

New Images (9/6/2023)

Short Video (about 1min: 19sec)

LV code Zip

Notes

Notes

  • Presentation: Example of a Sequence Editor/Creator using NI LabVIEW project template as a starting point. Simple just to spark some possible ideas.
  • Programming Language used: LabVIEW® 2019 Base version
  • LabVIEW® is a NI (formally National Instruments) products
  • Presentation app: Microsoft’s PowerPoint
  • Blue arrows created using: Microsoft’s Paint and placed in button with NI LabVIEW advance customize… control import from clipboard same size
  • Presentation shown to spark ideas of use.
  • This presentation is not connected to or endorsed by any company.
  • Use at your own risk.
  • Use NI LabVIEW® 2019 project template Queue Message Handler as starting point in Examples (also good way to learn different patterns if beginner.)
  • Tags: LabVIEW® , Project Template, LV2019,Queue Message handler, Events, Sequence Editor, Array functions, Ring data type, List box.
Posted in Test Sector | Tagged , , , , , , , | Leave a comment

LV XY Graph and Annotation

Presentation show example use of Annotation in XY Graph

Presentation

Added Oct 21 2023

LV Zip Code

Notes

Notes

•Presentation showing use of annotation on XY Graph (Simulation, Not Real Data)

•Programming Language used: LabVIEW® 2019 Base version

•LabVIEW® is a NI (National Instruments) product

•Presentation app: Microsoft’s PowerPoint

•Presentation shown to spark ideas of use.

•This presentation is not connected to or endorsed by any company.

•Use at your own risk.

•Tags:  LabVIEW® , XY Graph, Annotation, Color

Posted in Test Sector | Tagged , , , , , | Leave a comment

LabVIEW(R) Actor Framework – Example Use.

LabVIEW(R) Actor Framework Example Use.

Showing and example use of LabVIEW(R) Actor Framework using simulators

Presentation

Short Video (about 31 seconds)

Notes

Notes

•Showing parts of an example Temp cycle sim, UUT test sim ,Power supply sim using the LabVIEW® Actor Framework Project template as a starting point.

•Technologies used Classes, Object Orientated Programming(OOP), Encapsulation, Inheritance, Override, Dynamic Dispatch Actors, User Events.

•Presentation shown to spark ideas of use. (used LV2019)

•LabVIEW® is a National Instruments (NI) product

•This presentation is not connected or endorsed by any company

•Use at your own risk.

•One more note, which others have stated and applies to me also , Don’t spend your projects budget trying to look into every BASE Method of Actor Framework to figure how it works. Think top level (Actors, Methods, Messaging, User Events and Helper (Event Loop) , If new with AFW start with the NI Actor Framework Project template (2019) as I did.

Download

Posted in Uncategorized | Tagged , , | 2 Comments

LV calling Python via -c command line method

Presentation on how a LabVIEW developer can access a Python developers module(file) and functions using the -c command line mode

LV_PY3_CLSlide1LV_PY3_CLSlide2LV_PY3_CLSlide3LV_PY3_CLSlide4LV_PY3_CLSlide5LV_PY3_CLSlide6

Helpful links


Updated: Nov 02 2023

Updated Presentation

Presentation

Zip Code

Notes

  • Presentation: A way to call python functions from a script using system exec
  • Programming Language used:
    • LabVIEW® 2019 Base version (which only supports 2.7 and 3.6, but I need 3.7 or 3.11)
    • Python® 3.7 and 3.11 (conda environment that was made via Anaconda®)
  • LabVIEW® is a NI (formally National Instruments) product, now part of Emerson
  • Presentation app: Microsoft’s PowerPoint
  • Presentation shown to spark ideas of use.
  • Help resource:
    • Stackoverflow®
      • Google®’s Converse
        • Bing®’s AI Chat
  • This presentation is not connected to or endorsed by any company.
  • Use at your own risk.
  • Tags: LabVIEW®, Python®, SystemExec, Script, Editor, Python environment, Conda environments
  • In this presentation, the LV vi and the python script are in the SAME folder
  • Default for python field is python.exe if you want a different evns use the full path as done in the presentation
    • C:\Users\( )\Anaconda3\envs\py3p11\python.exe (py3p11 is what i name my conda for python version 3.11
    Posted in Test Sector | Tagged , , , , , | Leave a comment

    My Mississippi Harmonica Co Regal Model 96235

    Presentation in my search to find the notes on this particular harmonica (only the one I have)

    Presentation

    Notes

    • Presentation on my Harmonica: Mississippi Harmonic Co Regal Model 96235 Key of C (tremolo), 2 row,2 0 columns
    • Reason for presentation: I can find 2row,20hole diagrams, I can find the Model 96235, but I could not find them in the same article. So I want to find out what are the notes of the columns. (note each column has a near matching reed (yes two reed per column) that produce that unique sound of a tremolo.
    • Measurement is for my particular Harmonica (sample size= ONE) keep that in mind. I don’t know how others of the same model number perform. (there is always a possibility that my is an odd ball on since I have nothing to compare it with.) I hope its not because I like the sound it makes.
    • I am not a Music expert
    • Presentation app: Microsoft’s PowerPoint
    • Not sponsored or endorsed by any company
    • Use at your own risk.
    • Do not make any Harmonica decision without reviewing more information on the subject. There are many types and many different hole columns. There are One row type and two row types so review more information on the subject.
    • All measurements are for qualitative info only.
    • opinion : No Harmonic should be delivered without the note of each hole for both blow and draw holes (via harmonica diagram)
    • The F(2nd column) and A(4th column) draw notes for this 2row, 20column harmonic was new info to me (I think with my very limited music knowledge that that this particular model was gear to form a part of an F chord (FAC) only FA. My thinking is this harmonic is not mention much in my web searches for info because most other show for left side C chord (blow) and G chord draw again with my limited music knowledge. Potentially this (my harmonica) is for a particular style of music.
    • I only used normal beginner note playing, no fancy stuff, don’t even know if you can do fancy stuff with this model
    • Personal/opinion: I like the sound that comes out of this harmonic tremolo that the double reeds makes.
    • Tags: Harmonica,Tremolo,2×20 hole pattern, Mississippi Harmonica Co. Regal Model 96235
    Posted in Test Sector | Tagged , , | Leave a comment

    LabVIEW(r) , Python(r) Sinewave Fit

    Sinewave fit function from python script called via LabVIEW

    Presentation

    Code

    Zip

    Image

    python script

    # -*- coding: utf-8 -*-
    """
    Created on Tue Oct 31 06:38:35 2023
    
    @author: aleja
    """
    #MODIFIED For use by LabVIEW (see previous blog for python only)
    #Testing out code form Bing Chat as starting point
    #some modification added for clarity,and testing
    
    # Generate some sample data
    import numpy as np
    #import matplotlib.pyplot as plt
    
    N = 20 # number of data points
    amp = 2.0 # amplitude of the sinewave
    freq = 0.2 # frequency of the sinewave
    phase = np.pi / 4 # phase of the sinewave
    offset = 1.0 # offset of the sinewave
    noise = 0.01 # noise level  reduce from chat was 0.5 to see lest noise at first
    
    def MakeSineWaveData(amp,freq,phase,offset,N,noise):
        #number of cycle freq * max x
        # Create the x and y values
        x = np.linspace(0,10, N)  #changing this to test how strong this leastsq fit is
        y = amp * np.sin(2 * np.pi * freq * x + phase) + offset
        y += noise * np.random.randn(N) # add some noise
        print("===x===")
        #print(x)
        print(np.array2string(x, separator=',',formatter={'float_kind':lambda x: "%.3f" % x}))
        print("===End===")
        #print(y)
        print("===y===")
        print(np.array2string(y, separator=',',formatter={'float_kind':lambda x: "%.3f" % x}))
        print("===End===")    
        return x,y
    
    # #Test function here
    #x,y=MakeSineWaveData(amp,freq,phase,offset,N,noise)
    # # Plot the data
    # plt.scatter(x, y)
    # plt.xlabel("x-voltage")
    # plt.ylabel("y-optical detector")
    # plt.title("Sample data-fictional")
    # plt.show()
    
    
    #Next Fit testing out chat code
    # Fit a sinewave using least squares optimization
    from scipy.optimize import leastsq
    
    # Define the sinewave function
    def sin_func(p, x):
        A, f, p, c = p # unpack the parameters
        return A * np.sin(2 * np.pi * f * x + p) + c
    
    # Define the error function to minimize
    def error_func(p, x, y):
        return y - sin_func(p, x)
    
    # Make some initial guesses for the parameters
    p0 = [amp, freq, phase, offset]
    
    def GetSinewaveFitParameters(error_func,p0,x,y):
    # Optimize the parameters using least squares
        p_opt, p_cov = leastsq(error_func, p0, args=(x,y))
        return p_opt,p_cov
    
    # #test function here
    # p_opt,p_cov=GetSinewaveFitParameters(error_func,p0,x,y)
    
    # X = np.linspace(0, 10, N*10) #new x for better visual of sinewave
    # # Predict the y values using the optimized parameters
    # y_pred = sin_func(p_opt,X)
    
    # # Plot the inputdata(blue dots) and predicted curves(red line)
    # plt.plot(x,y,"b.",label="data")
    
    # plt.plot(X,y_pred,"r-",label="prediction")
    # plt.xlabel("x-voltage")
    # plt.ylabel("y-optical detector")
    # plt.title("Sinewave fitting using least squares-not real product data")
    # plt.legend()
    # plt.show()
    
    def Print_Sinewave_Info(amp,freq,phase,offset,N,x,y,p_opt,p_cov):
        #added print for simulation info
        #print will go to console (spyder or Labview stdout)
        print("===Simulated Paramters:===") #===section=== format need for LV extraction
        print(f"Number of Points: {N}")
        print(f"Number of cycles {freq*np.max(x):.1f}")
        print(f"Amplitude: {amp:.3f}")
        print(f"Frequency: {freq:.3f}")
        print(f"Phase: {phase:.3f}")
        print(f"Offset: {offset:.3f}")
        print(f"Noise: {noise:.3f}")
        print("===End===")
        print("\n")
        # Print the optimized parameters
        print("===Fit Parameters:===")
        print(f"Amplitude: {p_opt[0]:.3f}")
        print(f"Frequency: {p_opt[1]:.3f}")
        print(f"Phase: {p_opt[2]:.3f}")
        print(f"Offset: {p_opt[3]:.3f}")
        print("===End===")
        print("\n")
    # #Test out function
    #Print_Sinewave_Info(amp,freq,phase,offset,N,x,y,p_opt,p_cov)
    
    
    #added comments below not part of Chat info
    #summary: Chat created code was workable, added print to compare sim and fit
    #opinion: does a good job at fitting sinewave ...see presentation
    #opinion: best when provide with more points over cycle (most know this)
    #see blog presentation at www.testengineerresource.com
    #Environment used: python 3.11.3 and worked in Spyder IDE 5.4.3 (conda), mathplotlib 3.7.1
    #Environment info: I have plot show in own window (not in Spyder)
    #Plots are not clear to allow for testing of overlap sinewave fit.
    
    #getting version info
    #import matplotlib
    #print ('matplotlib: {}'.format (matplotlib.__version__))
    

    Notes

    • Presentation: LV calling python function for Sinewave fit via scipy (LV2019 base does not have fitting function)
    • Programming Language used:
    • LabVIEW® 2019 Base version (which only support 2.7 and 3.6 I need 3.7 or 3.11)
    • Python® 3.7 and 3.11(conda environment that was made via Anaconda®)
    • LabVIEW® is a NI (formally National Instruments) products, now part of Emerson
    • Presentation app: Microsoft’s PowerPoint
    • Presentation shown to spark ideas of use.
    • Help resource : Stackoverflow®, Google®’s Converse, Bing®’s AI Chat
    • This presentation is not connected to or endorsed by any company.
    • Use at your own risk.
    • Tags: LabVIEW® , Python®, SystemExec, Script, Editor, Python environment , Conda environments,Scipy® , example of LabVIEW and Python, Sinewave Fitting
    • In this presentation the LV vi and the python script are in the SAME folder
    Posted in Test Sector | Tagged , , , , , , , , , | Leave a comment

    LV- Event Queue and fun with Pict function

    A bit on the funnier side use of LabVIEW(r) with important pattern commonly used.

    Created a face to control eyes and eyebrow.

    Project started using NI project template.

    Presentation

    Short Video (17sec)

    Zip LV code

    Notes

    Notes

    • Presentation: A fun example of Event Queue and PICT with a Eyes and Eyebrow. Programming Language used: LabVIEW® 2019 Base version
    • LabVIEW® is a NI (formally National Instruments) products
    • Presentation app: Microsoft’s PowerPoint
    • Presentation shown to spark ideas of use.
    • This presentation is not connected to or endorsed by any company.
    • Use at your own risk.
    • Use NI LabVIEW® 2019 example for discussion (also good way to learn for beginners.)
    • Tags: LabVIEW® , Project Template, LV2019, Event-Queue Pattern, Producer –Consumer Pattern, PICT
    Posted in Test Sector | Tagged , , , , | Leave a comment

    LV Timed Loop Structure – OFFSET

    A Look at an LabVIEW(r) timed loop structure with focus on the Offset parameter Tzero T0

    Presentation

    Zip LV Modified Example Timed Structure OFFSET

    The original code you can get from the LabVIEW’s ,examples, structure, timed loop.

    The modified example in presentation is below this line.

    Notes

    Notes

    • Presentation: Example of Time Loop structure using provided example and modified example with focus on the OFFSET Parameter (Tzero)
    • Programming Language used: LabVIEW® 2019 Base version
    • LabVIEW® is a NI (formally National Instruments) products
    • Presentation app: Microsoft’s PowerPoint
    • Presentation shown to spark ideas of use.
    • This presentation is not connected to or endorsed by any company.
    • Use at your own risk.
    • Use NI LabVIEW® 2019 example for discussion (also good way to learn for beginners.)
    • Tags: LabVIEW® , Project Template, LV2019,Timed Loop Structure, Array, Waveform Chart, Offset, Tzero
    Posted in Test Sector | Tagged , , , , , , | Leave a comment

    Arduino PID with Motor, Ultrasonic Sensor, and a paper basket type coffee filter

    Using a PID to control a Motor via PWM using the Ultrasonic sensor HC-SR04 to control a coffee filter distance from the sensor.

    Presentation

    Zip Code (Arduino Uno PID Motor and HC-SR04 with coffee filter)

    Text Arduino Uno Code for PID Motor and HC-SR04 with coffee filter

    /*
     * Ultrasonic Simple
     * Prints the distance read by an ultrasonic sensor in
     * centimeters. They are supported to four pins ultrasound
     * sensors (like HC-SC04) and three pins (like PING)))
     * and Seeed Studio sensors).
     *
     * The circuit:
     * * Module HR-SC04 (four pins) or PING))) (and other with
     *   three pins), attached to digital pins as follows:
     * ---------------------    --------------------
     * | HC-SC04 | Arduino |    | 3 pins | Arduino |
     * ---------------------    --------------------
     * |   Vcc   |   5V    |    |   Vcc  |   5V    |
     * |   Trig  |   12    | OR |   SIG  |   13    |
     * |   Echo  |   13    |    |   Gnd  |   GND   |
     * |   Gnd   |   GND   |    --------------------
     * ---------------------
     * Note: You do not obligatorily need to use the pins defined above
     * 
     * By default, the distance returned by the read()
     * method is in centimeters. To get the distance in inches,
     * pass INC as a parameter.
     * Example: ultrasonic.read(INC)
     *
     * created 3 Apr 2014
     * by Erick Simões (github: @ErickSimoes | twitter: @AloErickSimoes)
     * modified 23 Jan 2017
     * by Erick Simões (github: @ErickSimoes | twitter: @AloErickSimoes)
     * modified 03 Mar 2017
     * by Erick Simões (github: @ErickSimoes | twitter: @AloErickSimoes)
     * modified 11 Jun 2018
     * by Erick Simões (github: @ErickSimoes | twitter: @AloErickSimoes)
     *
     * This example code is released into the MIT License.
     */
    //above is from orignal UltrsonicSimple example to give mentioning credit
    
    //this code below is a modification from the example for the coffee filter motor and distance
    
    #include <Ultrasonic.h> //ES's Ultrasonic library  ( I used the 4pin version of HC-SR04)
    #include <PID_v1.h>   //BB's PID
    
    #define MotorPWM 6  // motor control via the TIP120
    
    /*
     * Pass as a parameter the trigger and echo pin, respectively,
     * or only the signal pin (for sensors 3 pins), like:
     * Ultrasonic ultrasonic(13);
     */
    Ultrasonic ultrasonic(12, 13);
    double distance,distance_avg;
    double motor;
    double Setpoint=60; // cm
    double avg=100;
    double avg_meas;
    unsigned long Setpoint_change=0;
    
    //Specify the links and initial tuning parameters
    double Kp=1, Ki=10, Kd=0.0;
    
    
    PID myPID(&distance,&motor, &Setpoint, Kp, Ki, Kd,REVERSE);  // reverse not direct
    
    void setup() {
      Setpoint=42;
      Serial.begin(9600);
        //turn the PID on
      myPID.SetMode(AUTOMATIC);   
      myPID.SetOutputLimits(0,255);
      myPID.SetSampleTime(50);
    }
    
    void loop() {
      // Pass INC as a parameter to get the distance in inches
    
     for (int i=0;i<avg;i++) {
      distance_avg = ultrasonic.read();
      avg_meas=avg_meas + distance_avg;
     }
     avg_meas=avg_meas/avg; 
     distance=avg_meas;
      
      myPID.Compute();
      //motor=map(distance,0,90,0,255);
      Serial.print("Setpoint:");
      Serial.print(Setpoint);
      Serial.print(",");   
      Serial.print("MotorPWM:");
      Serial.print(motor);   //motor is getting updated by the myPID.Compute
      //motor=255-motor;  // if closer to sensor less cm also less motor
      Serial.print(",");   
      analogWrite(MotorPWM, motor);
      Serial.print(" Distance_CM:");
      Serial.println(distance);
      delay(2);
      avg_meas=0;
    }
    

    Notes

    • Presentation: Arduino® Uno with BB’s PID with Motor , Distance Sensor with ES’s Ultrasonic library, and Coffee filter
    • Programming Language used: Arduino® IDE
    • Hardware Use: Motor, HHC-SR04 distance Sensor, TIP120 transistor ,Arduino® Uno ,Solderless Breadboard. Various jumper type wire.
    • Helpful resource: Arduino communities and Arduino’s IDE library manager.
    • Arduino® products of respective companies
    • Presentation shown to spark ideas of use.
    • This presentation is not connected to or endorsed by any company.
    • Use at your own risk.
    • Tags: PID, Kp, Ki, kd, derivative , integral, Serial plotter
    • Title Tag: Arduino® Uno and BB’s PID, Motor, Distance Sensor, HC-SR04, TIP120, PID, coffee filter
    • Presentation is part of Blog content: https://testengineerresource.com/
    Posted in Test Sector | Tagged , , , , , , , , , | Leave a comment

    Using Arduino and BB’s PID with Simple LED Brightness setup to Learn PID

    Presentation

    Arduino Code for this project

    //********************************************************
    // * PID Basic Example used as starting point with change below
    // * Reading analog input 0 to control analog PWM output 6
    // ********************************************************/
    
    #include <PID_v1.h>
    
    #define PIN_INPUT 0
    #define PIN_OUTPUT 6
    
    //Define Variables we'll be connecting to
    double Setpoint, Input, Output;
    double Input_Map,avg_meas;
    //Specify the links and initial tuning parameters
    double Kp=0.04, Ki=11.00, Kd=0.0001;
    double error;
    double avg=100;
    unsigned long Setpoint_change=0;
    
    
    PID myPID(&Input,&Output, &Setpoint, Kp, Ki, Kd,DIRECT);  //
    
    void setup()
    {
      //initialize the variables we're linked to
      Input = analogRead(PIN_INPUT);
    
      Setpoint = 700;
      Serial.begin(9600);
      //turn the PID on
      myPID.SetMode(AUTOMATIC);
      myPID.SetOutputLimits(0,255);
      myPID.SetSampleTime(20);
    }
    
    void loop()
    {
    
        if(Setpoint_change==100){
        Setpoint=500;
        }
      if(Setpoint_change==200){
        Setpoint=300;
      }
      if(Setpoint_change==300){
        Setpoint=700;
        }
      if(Setpoint_change==400){
        Setpoint=512;
        }        


     for (int i=0;i<avg;i++) {
      Input_Map = analogRead(PIN_INPUT);
       avg_meas=avg_meas + Input_Map;
       }
      avg_meas=avg_meas/avg; 
      Input=avg_meas;
       myPID.Compute();
      //delay(1); //ms
      analogWrite(PIN_OUTPUT, Output);
      Setpoint_change=Setpoint_change+1;
      Serial.print("Input:");
      Serial.print(Input);
      Serial.print(",");
      Serial.print("Output:");
      Serial.print(Output);
      Serial.print(",");
      Serial.print("Setpoint:");
      Serial.print(Setpoint);
      Serial.print(",");
      error=Setpoint-Input;   //was input-setpoint  but not traditonal
      Serial.print("error:");
      Serial.print(error);
      Serial.print(",");
      Serial.print("maxout:");
      Serial.print(255);
      Serial.println(","); 
      
    }
    

    Zip code

    Notes

    • Presentation: Arduino® Uno with BB’s PID with Light and detect circuit
    • Programming Language used: Arduino® IDE
    • Hardware Use: Snapino™ (using the phototransistor), Keyes(using its One Led light module has transistor in its module) other jumper I got from MicroCenter store.
    • Helpful resource: Stackoverflow, Search Engines , Bing chat AI, and Arduino communities.
    • Bing is a Microsoft’s product.
    • Arduino® ,Snapino™, and Keyes are products of respective companies
    • Presentation shown to spark ideas of use.
    • This presentation is not connected to or endorsed by any company.
    • Use at your own risk.
    • Tags: PID, Kp, Ki, kd, derivative , integral, Serial plotter
    • Title Tag: Arduino® Uno and BB’s PID
    • Presentation is part of Blog content: https://testengineerresource.com/
    Posted in Test Sector | Tagged , , , , , , | Leave a comment

    Python-A way to show digital patterns(bits) in Matplotlib

    Presentation on a way to show digital patterns (bits) visually in Matplotlib

    drawstyle was helpful but did not show the pattern correctly 100%(for me)

    below is my presentation followed by the code.

    Presentation

    Python Code Text

    # -*- coding: utf-8 -*-
    """
    Created on Fri May 19 21:01:14 2023
    
    @author: aleja
    """
    
    import matplotlib.pyplot as plt
    
    #this demo uses same size bits for all data
    #real data (you will use for any processing _ the visual data is only for plots)
    data0=[1,1,1,1,0,0,0,0]
    data1=[1,1,0,0,0,0,0,0]
    data2=[1,0,1,0,1,0,1,0]
    data3=[0,0,0,0,1,1,1,1]
    data4=[0,0,0,0,0,0,0,1]
    plots=[data0,data1,data2,data3,data4] #show this digital pattern
    
    #the many step way to make [0-------n] in data1
    # x_data_pt=[]
    # x= len(data1)
    # print(x) 
    # for i in range(x):   
    #     x_data_pt.append(i)
    # print (x_data_pt)
    #fix my plot so it looks ok (fix width digital bit)
    def Make_My_Dig_Plot_look_ok(datas_holder):
        data_long=[]
        visual_plots=[]
        for n,data in enumerate(plots):
            data_long=[]
            for bit in data:        
                for i in range(1):
                 data_long.append(bit)
            data_long.append(bit)
            visual_plots.insert(n,data_long)
        print(visual_plots)
        return visual_plots        #for visual
    
    new_plots=Make_My_Dig_Plot_look_ok(plots)
    x_data_pt = [(i-0.5) for i in range(len(new_plots[0]))]  #the one line way and a slight 1/2 bit shift 
    # print(x_data_pt)
    plt.clf()
    plt.close()
    fig,axs=plt.subplots(len(new_plots),sharex=True)  # add sharex if you dont want all x axis number on each, odd but works num="Title"
    mngr = plt.get_current_fig_manager()
    mngr.window.setGeometry(20,60,640, 545)  #Location and size
    mngr.window.setWindowTitle("A way to show digital bits multiple patterns")  #I am using this way to put title on figure window
    # https://stackoverflow.com/questions/38307438/set-matplotlib-default-figure-window-title
    fig.suptitle('Digitial Pattern', fontsize=16)
    for plotnum in range(len(plots)):
    #     #none of these are exactly what i want with the Origianl data is the closest but its chops the left and right half width (dont like that look)
    #     with the function fixing step=post is the best for me
          #if plotnum==0:axs[plotnum].set_title("Digital Patterns")
          axs[plotnum].plot(x_data_pt,new_plots[plotnum],drawstyle="steps-post")
          axs[plotnum].set_ylabel("Data"+str(plotnum))  #how to put y axis label
    #     axs[plotnum].plot(x_data_pt,plots[plotnum],drawstyle="steps-mid") #almost right but chops my least significant bit and most sig bit width
    #     #axs[plotnum].plot(x_data_pt,plots[plotnum],drawstyle="steps-pre")
    #     #axs[plotnum].plot(x_data_pt,plots[plotnum],drawstyle="steps")


    Python Code Zip

    Notes

    • Presentation: Showing a possible way to show digital pattern (bits) in Matplotlib
    • Programming Language used: Python 3.9 in Spyder5.4.3,Matplotlib 3.7.1
    • Presentation app: Microsoft’s PowerPoint
    • Helpful resource: Stackoverflow, Search Engines , Bing chat AI, and Python communities.
    • Bing is a Microsoft’s product.
    • Python, Tkinter, and Matplotlib are products of respective companies
    • Presentation shown to spark ideas of use.
    • This presentation is not connected to or endorsed by any company.
    • Use at your own risk.
    • Tags: Python, Python3.9, Matplotlib , Digital (bits) Patterns
    • Title Tag: Showing ‘a’ possible way to show digital pattern (bits) in Matplotlib
    Posted in Test Sector | Tagged , , , | Leave a comment