
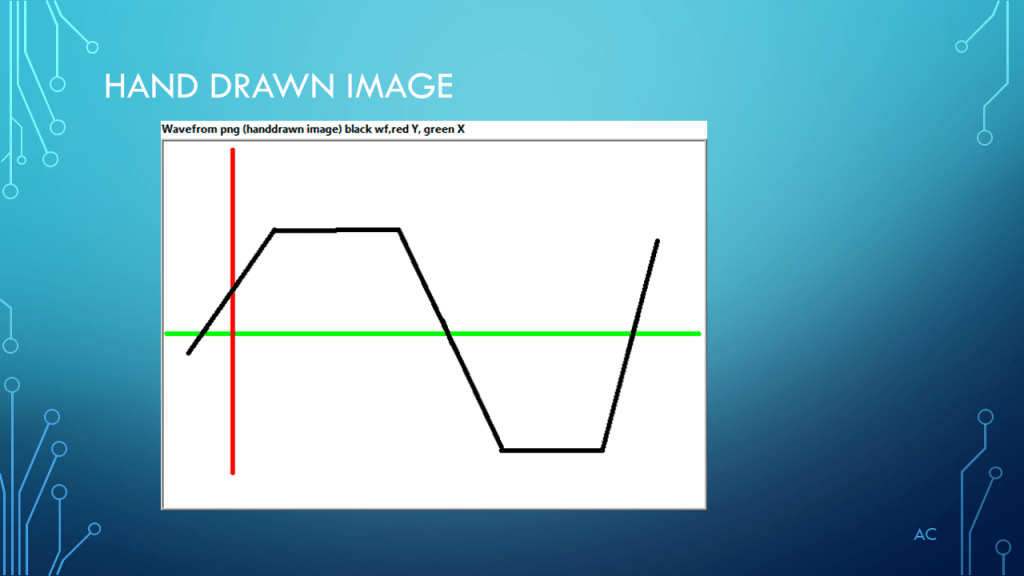
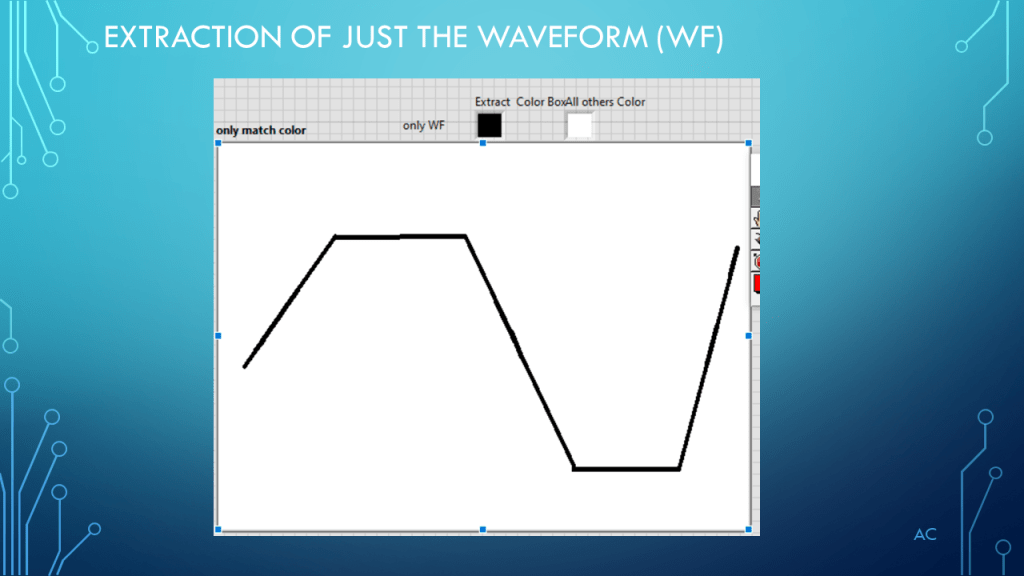
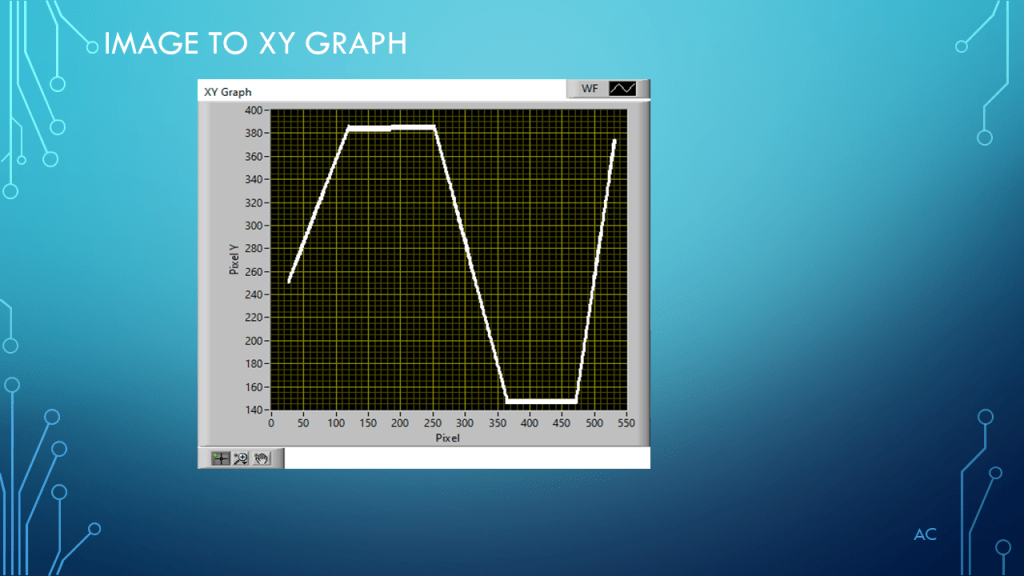
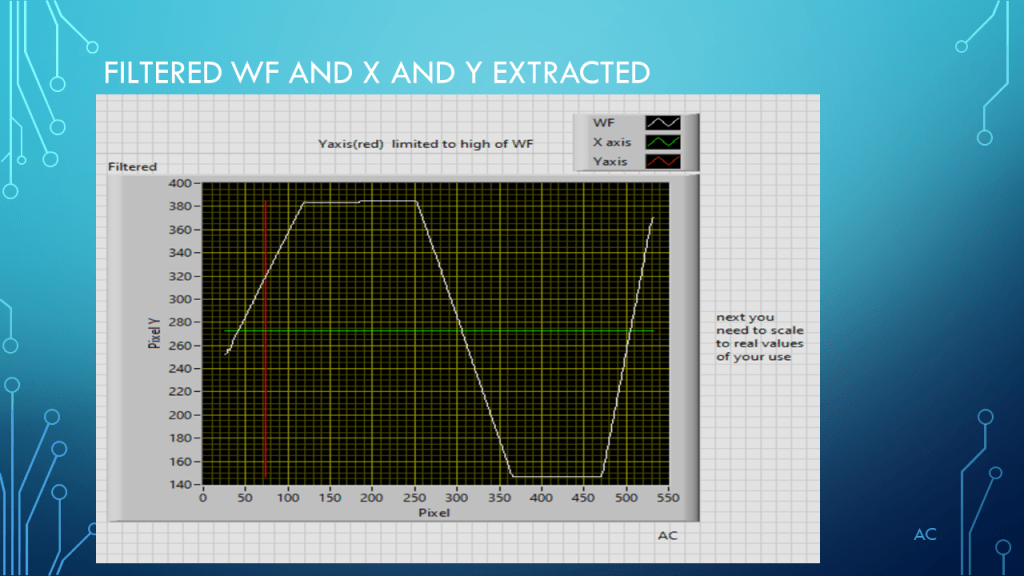
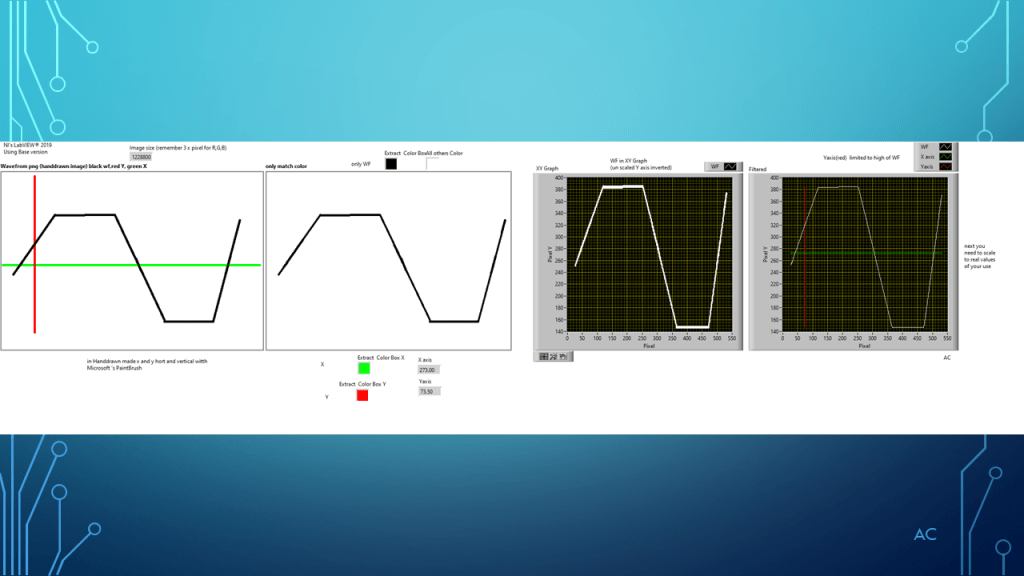
Using a hand drawn image with specific color for each element ( Wavefrom Black, X axis -Green, and Y axis-Red convert it to XY Graph.
Below is the presentation for this post using MS PowerPoint (r)
Notes
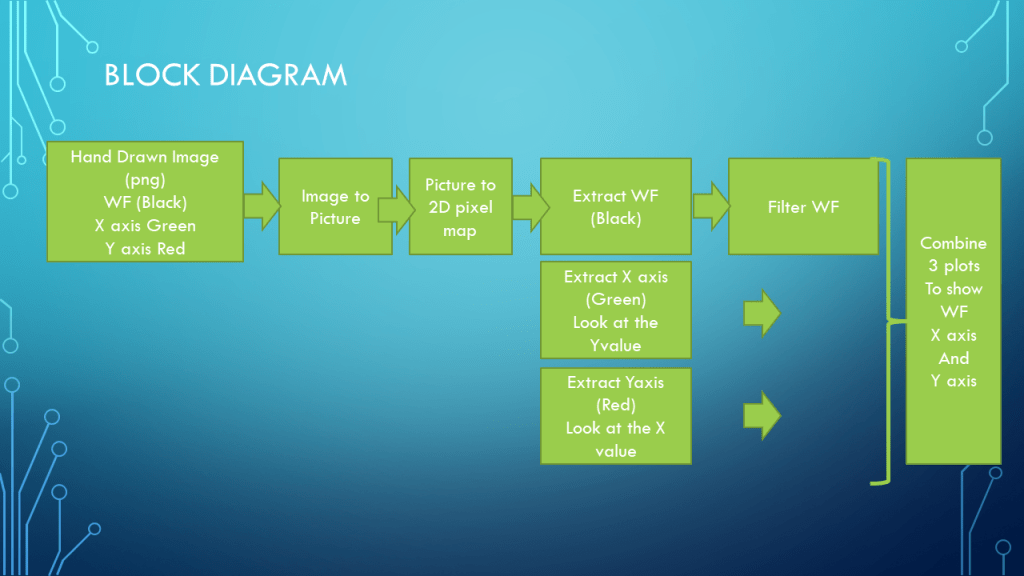
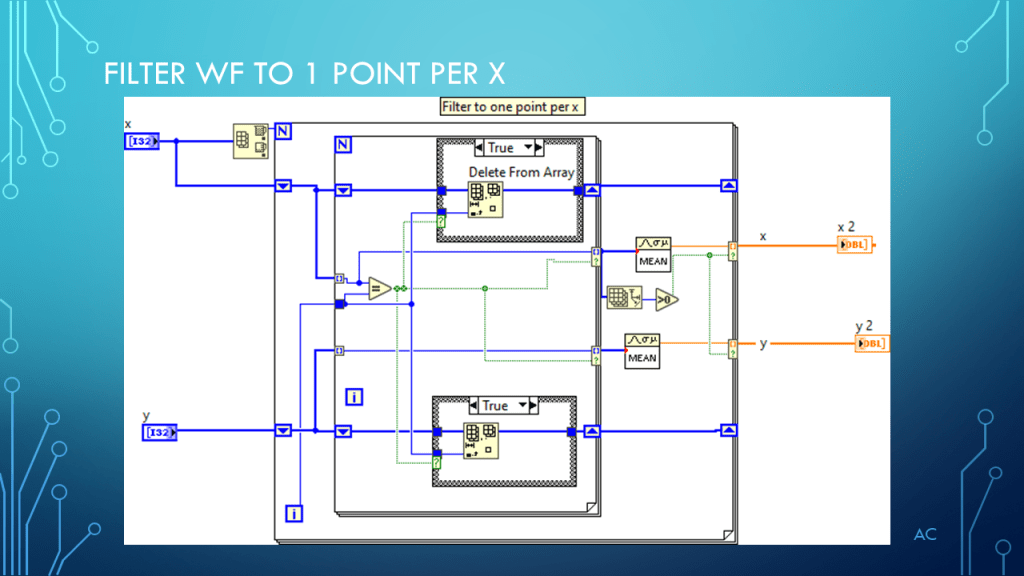
• Showing how to take a hand drawn image to XY Graph
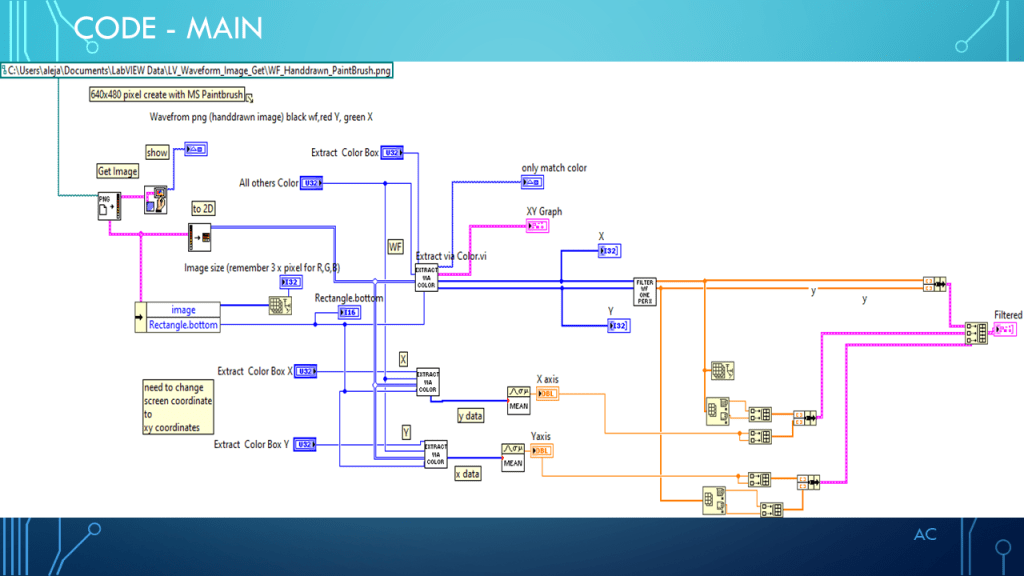
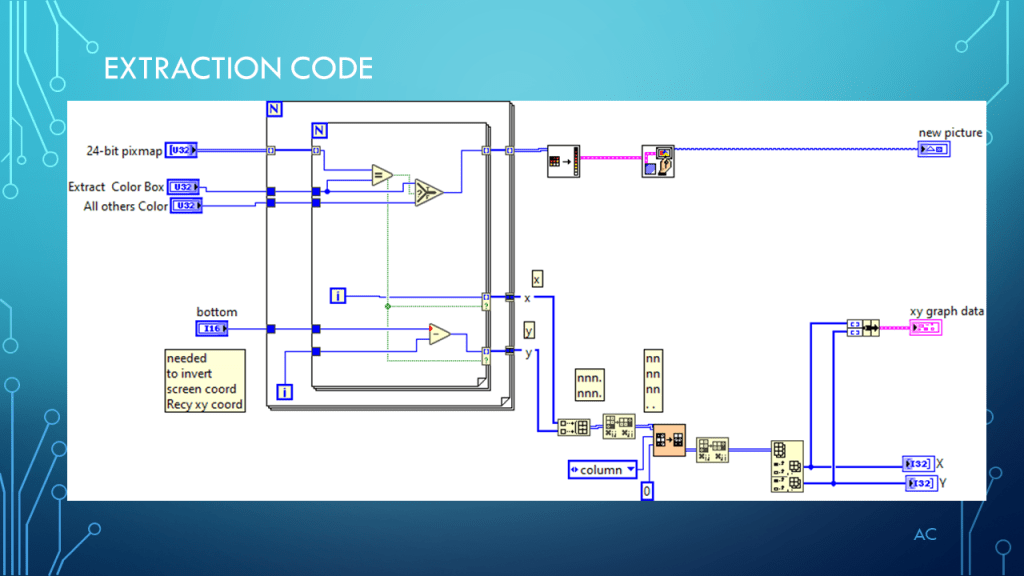
• Technologies used Image file to Picture (PNG) and Picture to 2D map.
• Presentation shown to spark ideas of use.
• (used LV2019 Base version-most fitting function are not in base so had to use mean for x and y axis)
• LabVIEW® 2019 is a National Instruments (NI) product
• This presentation is not connected to or endorsed by any company
• Use at your own risk.
