
Presentation show example use of Annotation in XY Graph
Presentation
Added Oct 21 2023
LV Zip Code
Notes
Notes
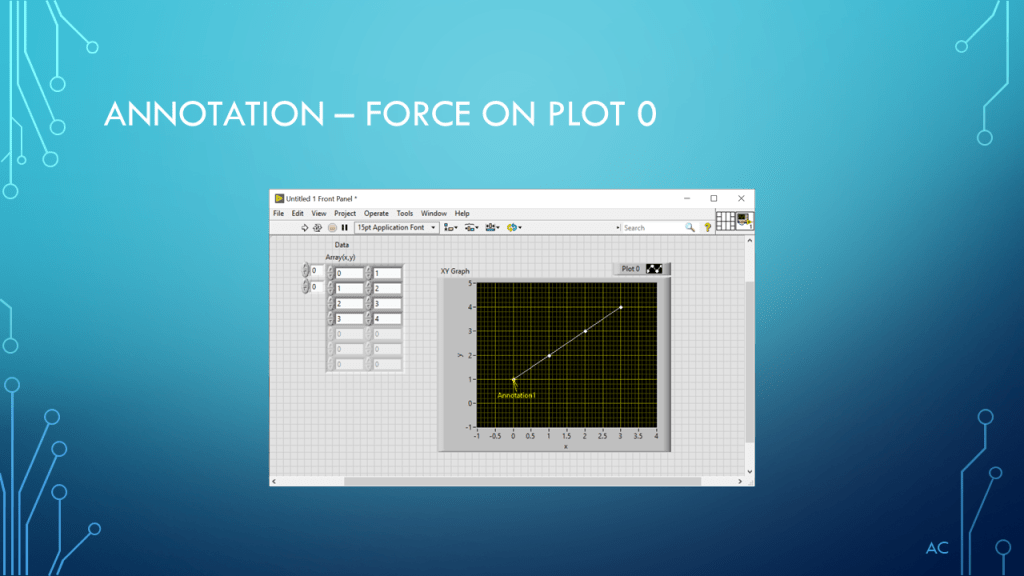
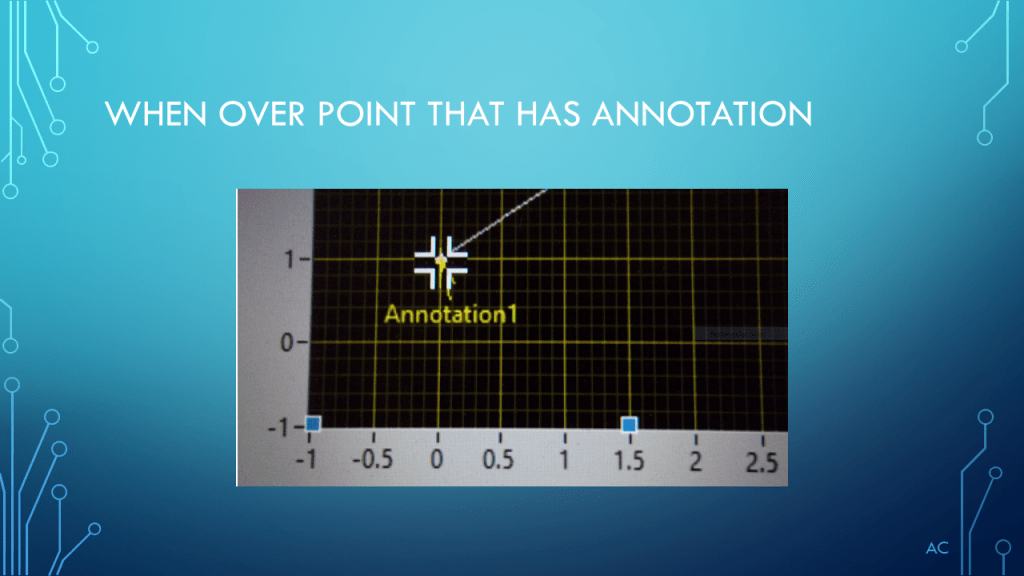
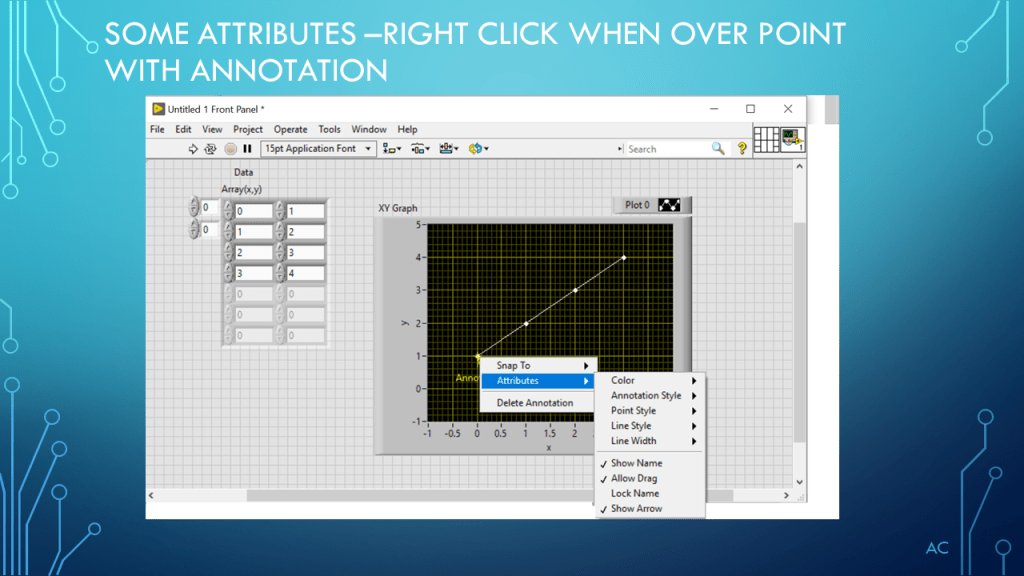
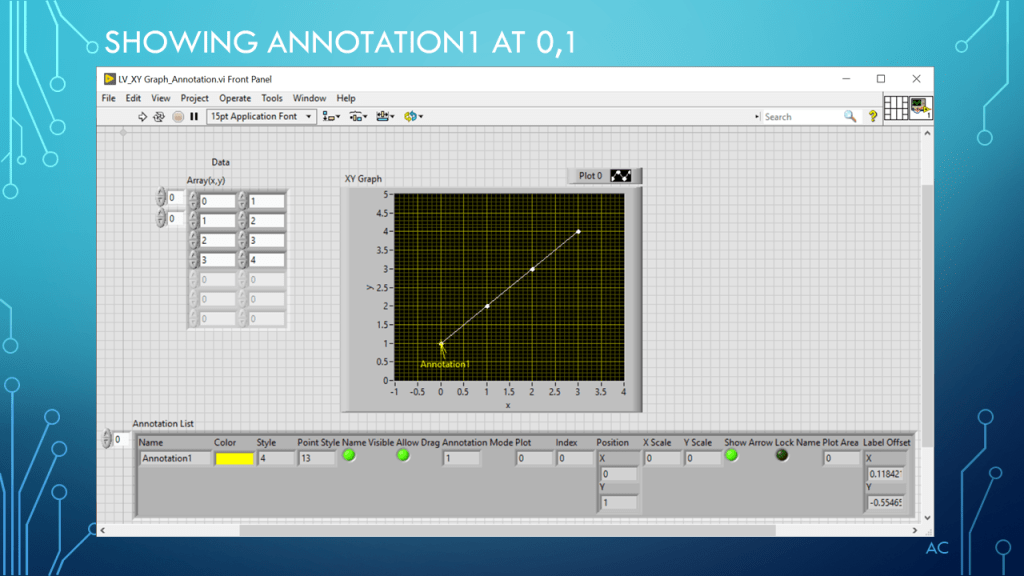
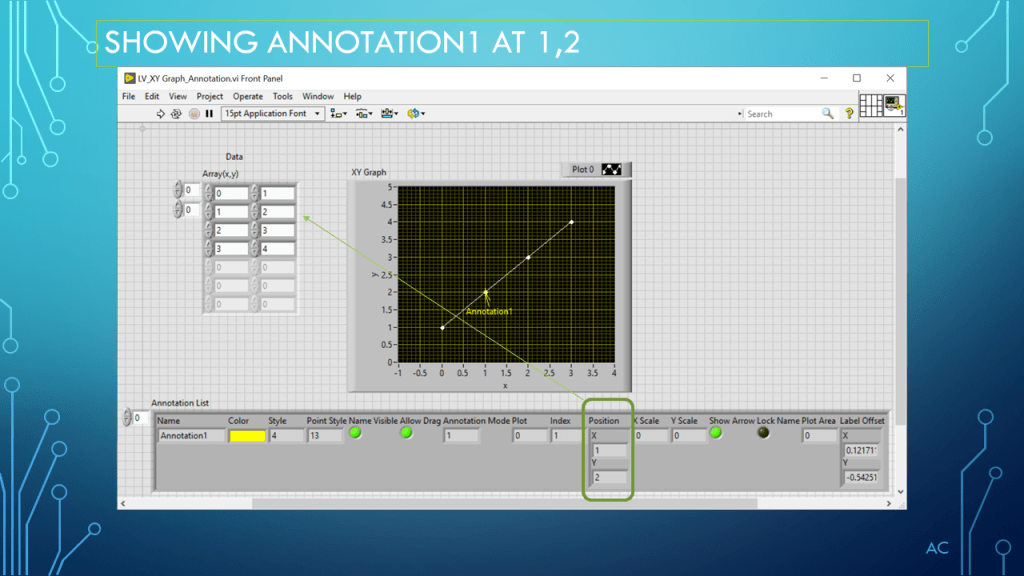
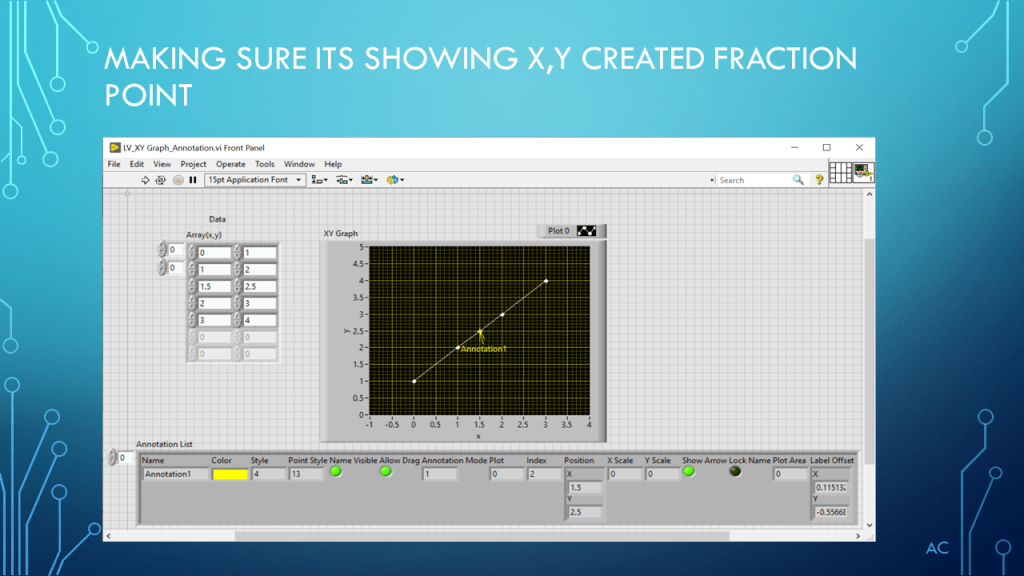
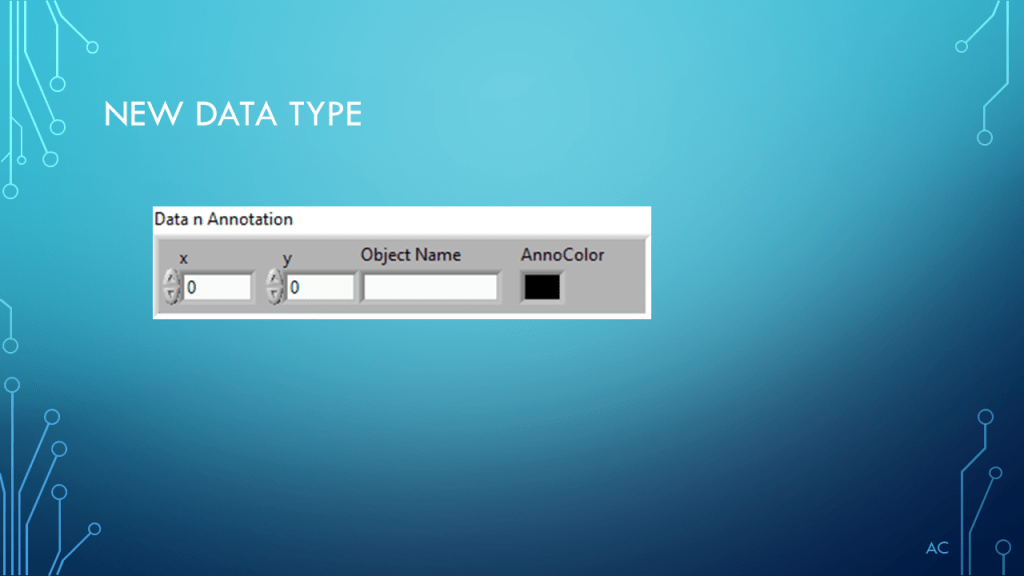
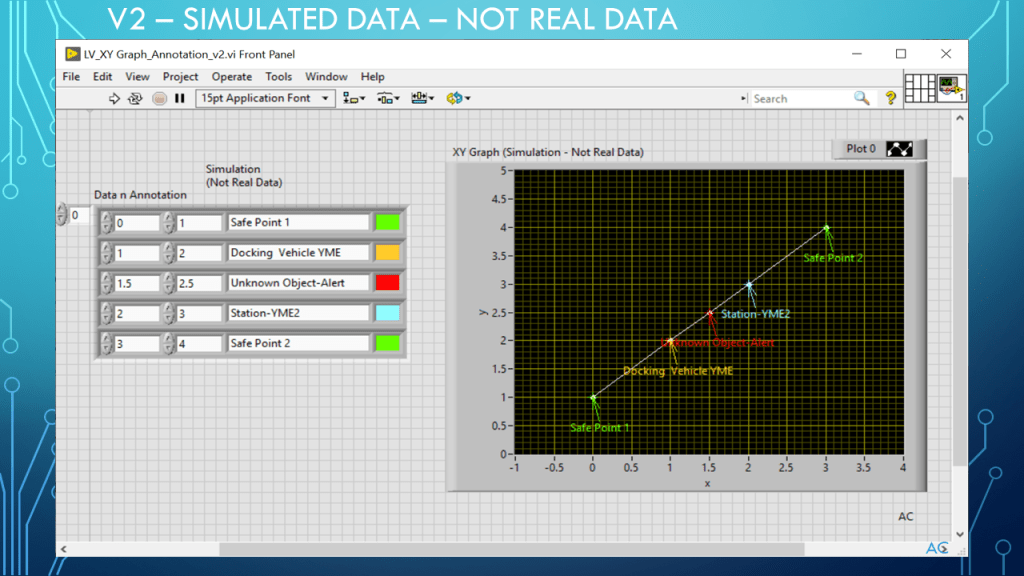
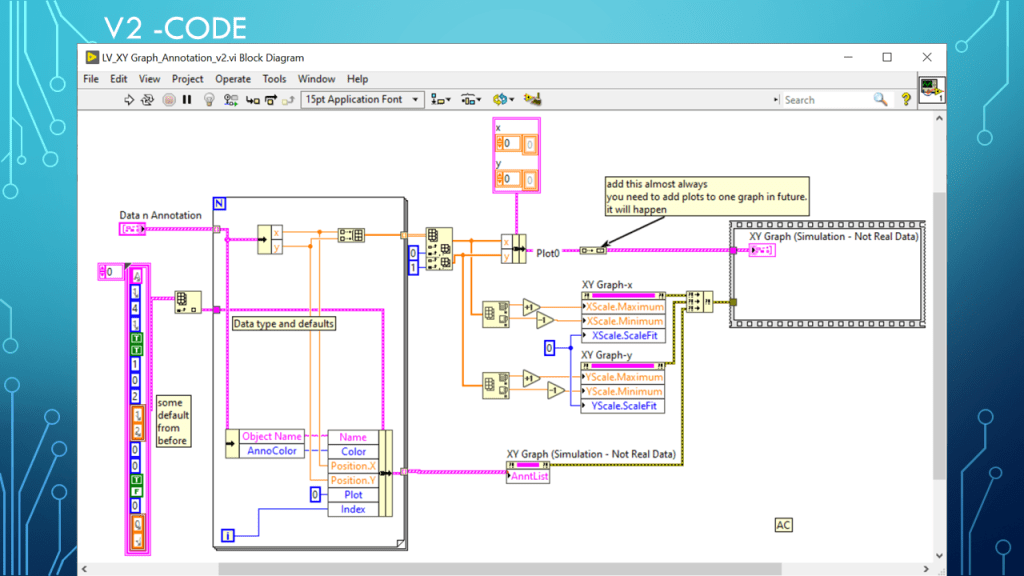
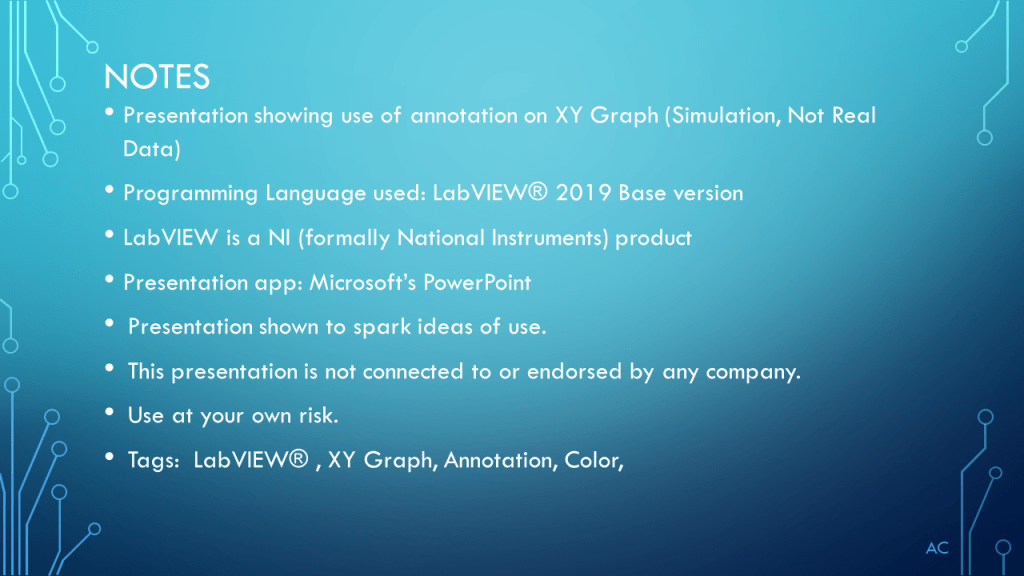
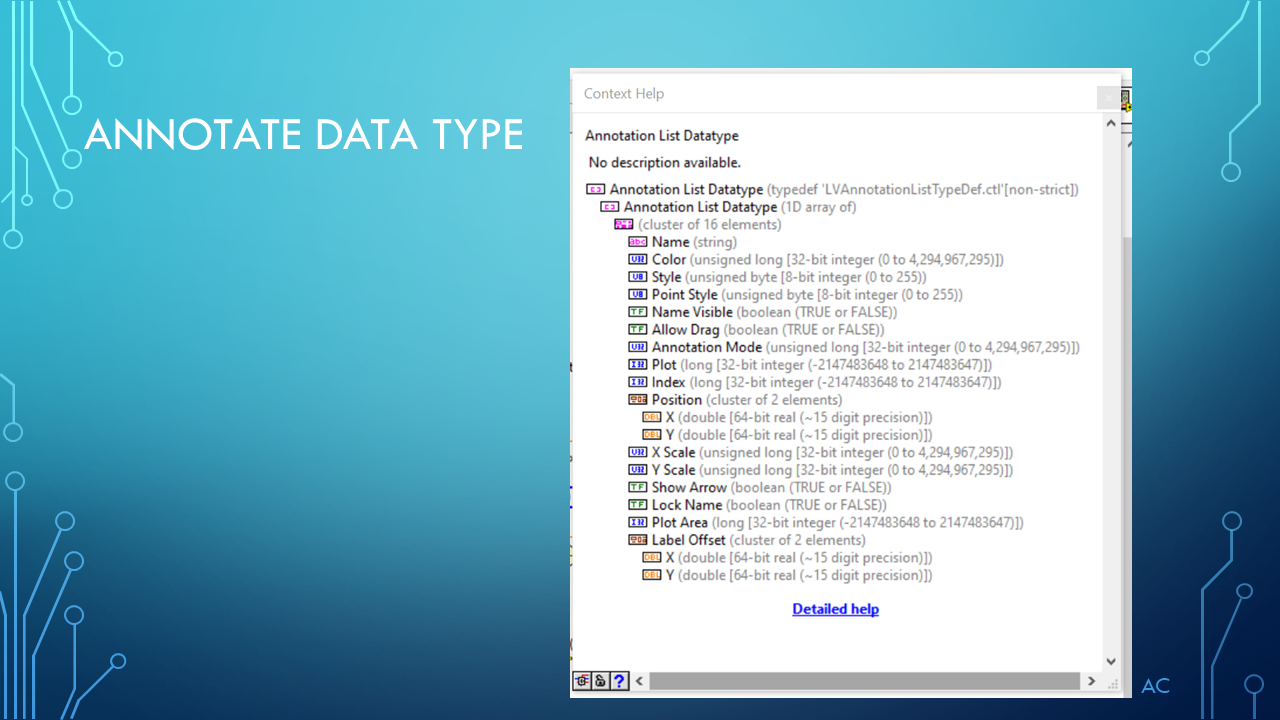
•Presentation showing use of annotation on XY Graph (Simulation, Not Real Data)
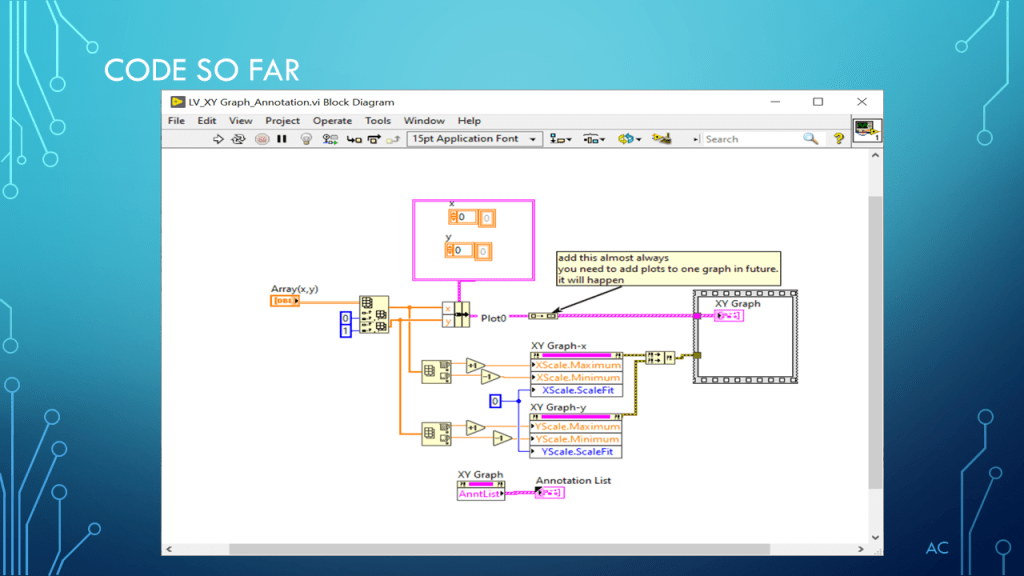
•Programming Language used: LabVIEW® 2019 Base version
•LabVIEW® is a NI (National Instruments) product
•Presentation app: Microsoft’s PowerPoint
•Presentation shown to spark ideas of use.
•This presentation is not connected to or endorsed by any company.
•Use at your own risk.
•Tags: LabVIEW® , XY Graph, Annotation, Color
