
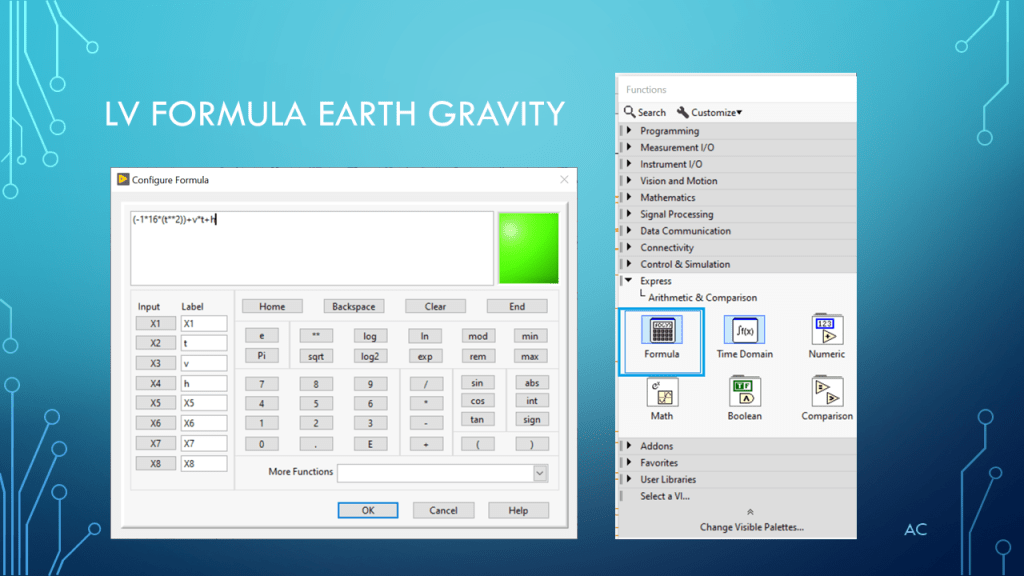
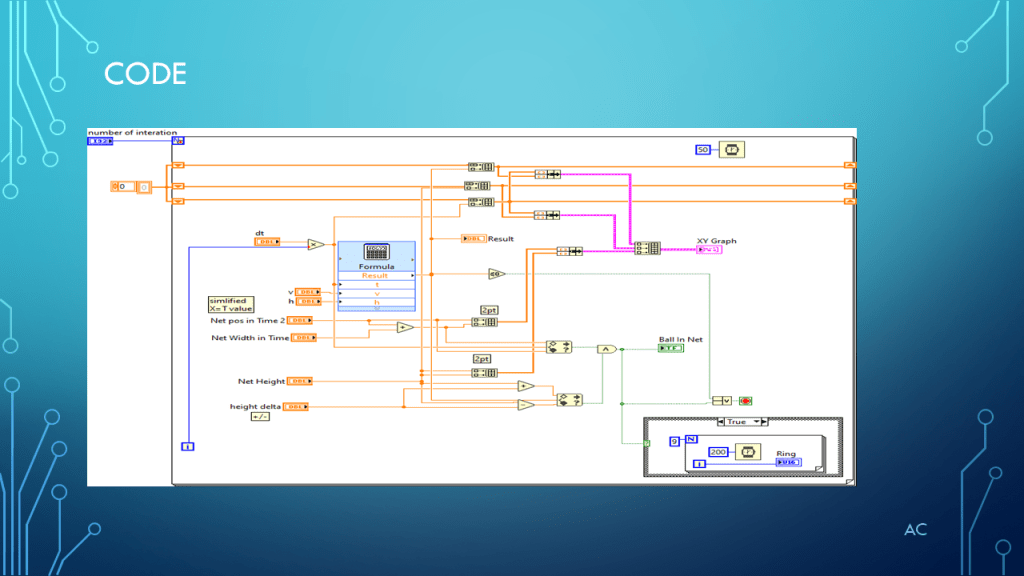
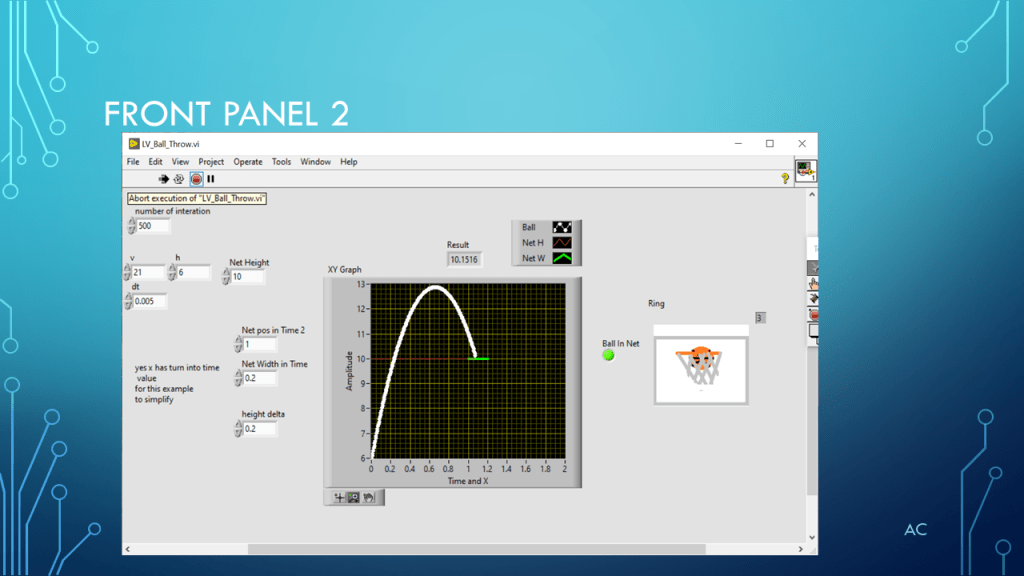
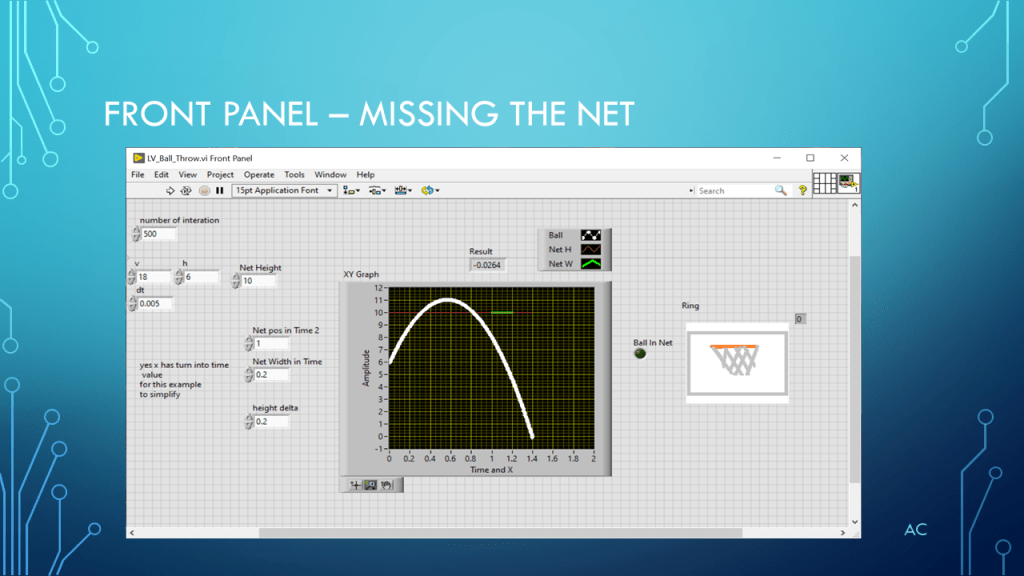
Using LabVIEW(R) ‘s Formula, XY Graph, Pict Ring, and Microsoft’s Paint app
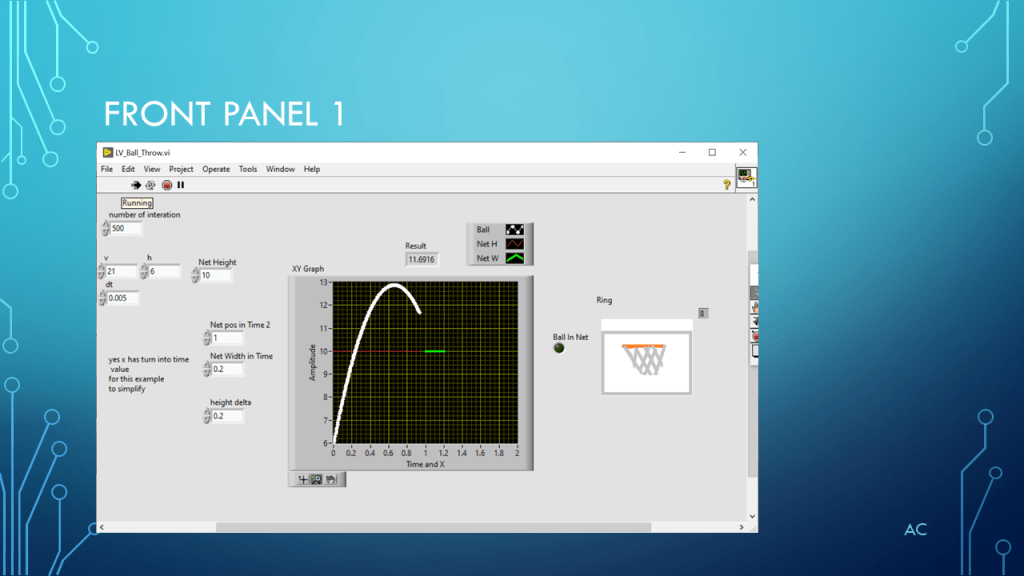
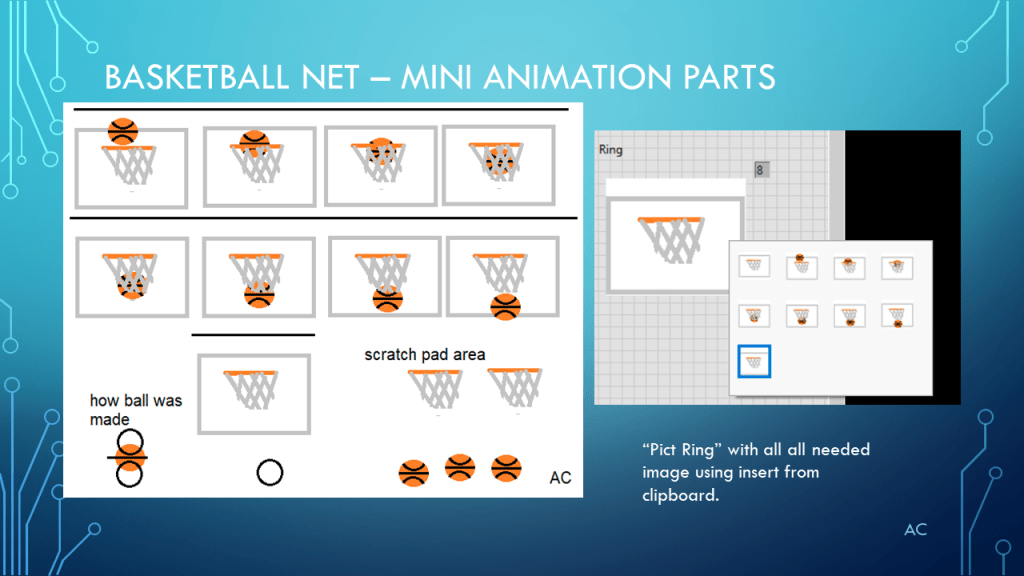
Microsoft Paint used to created net and ball 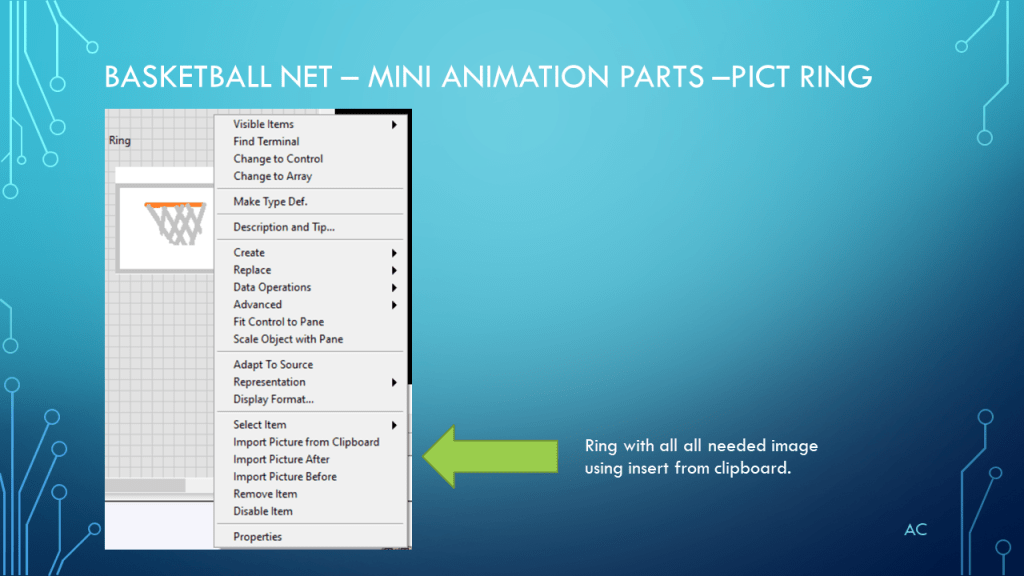
Notes
• This is an example and by no means a complete solution.
• Created to show multiple plots on “XY Graph” and mini animation with Pict Ring
• Topic Tags: “Formula”, “XY Graph”, ”Pict Ring”, ”Mini Animation”, ”Earth Gravity”
• Used LV2019 in this presentation
• LabVIEW® is a “National Instrument” (NI) product.
• PowerPoint is a Microsoft product.
• Presentation shown to spark ideas of use.
• This presentation is not connected to or endorsed by any company.
• Use at your own risk.
