Presentation on taking a file with the following format:
- [Section]
- Header0, Header1
- Data1x, Data1y
- Datanx,Datany
- ******
# -*- coding: utf-8 -*- """ Created on Mon Nov 18 15:36:01 2019 Updated Mar 10 2021 - Added matplotlib import @author: aleja """ from matplotlib.figure import Figure import matplotlib.pyplot as plt #======================================= #read x,y from file columns #file format #[Section] #Header0,Header1 #Data1x,Data1y #Datanx,Datany #******* filerows=[] sections=[] x2 = [] y2 = [] #file in same folder as python file with open ("testreport1.txt") as myfile: for line in myfile: filerows.append(line) print (line) #Lets find where all the section are located for i in range(len(filerows)): if((filerows[i].find("["))>=0): #print (filerows[i]) sections.append({"section":filerows[i],"sectionindex":i}) print(sections) #find RF_Meas2 foundsection=0 SectionToPlot = "RF_Meas2" for i in range(len(sections)): if(sections[i]["section"].find(SectionToPlot)>=0): print (sections[i]["section"],sections[i]["sectionindex"]) foundsection=foundsection+1; section_index=sections[i]["sectionindex"] #simple test of file if foundsection==0: print ("I did not find the section please review file or SelectionToPlot") elif foundsection>1: print ("File has multiple sections with the same name - not a correct file format") else: #get Sections Header info Header=[] Header=filerows[section_index+1].split(',') print(Header) Header[-1]=Header[-1].rstrip() #get rid of \n at end of last element print(Header) #next data print(len(filerows)) section_data_start=section_index+2 while (filerows[section_data_start].find("****")<0 and section_data_start<=len(filerows)): dataxy=filerows[section_data_start].split(",") x2.append(float(dataxy[0])) #remember you need to turn string to number y2.append(float(dataxy[1].rstrip())) #remember you need to turn string to number section_data_start=section_data_start+1 print(section_data_start) print(x2,y2) plt.plot (x2,y2) print (Header[0],Header[1]) plt.xlabel(Header[0]) plt.ylabel(Header[1]) plt.title(SectionToPlot,fontsize=20) plt.show()
File example (testreport1.txt)
[RF_Meas1]
Freq_MHz,Output1_dB
100,20
200,20
300,19
400,19
500,19
600,18
700,17
800,15
900,12
1000,10
******
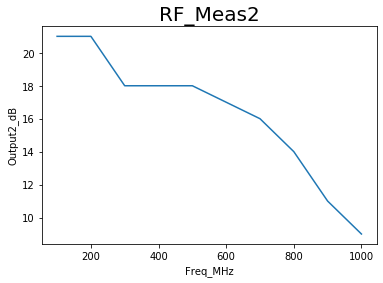
[RF_Meas2]
Freq_MHz,Output2_dB
100,21
200,21
300,18
400,18
500,18
600,17
700,16
800,14
900,11
1000,9
******
IPython console output
[RF_Meas1]
Freq_MHz,Output1_dB
100,20
200,20
300,19
400,19
500,19
600,18
700,17
800,15
900,12
1000,10
******
[RF_Meas2]
Freq_MHz,Output2_dB
100,21
200,21
300,18
400,18
500,18
600,17
700,16
800,14
900,11
1000,9
******
[{‘section’: ‘[RF_Meas1]\n’, ‘sectionindex’: 0}]
[{‘section’: ‘[RF_Meas1]\n’, ‘sectionindex’: 0}, {‘section’: ‘[RF_Meas2]\n’, ‘sectionindex’: 13}]
[RF_Meas2]
13
[‘Freq_MHz’, ‘Output2_dB\n’]
[‘Freq_MHz’, ‘Output2_dB’]
26
16
17
18
19
20
21
22
23
24
25
[100.0, 200.0, 300.0, 400.0, 500.0, 600.0, 700.0, 800.0, 900.0, 1000.0] [21.0, 21.0, 18.0, 18.0, 18.0, 17.0, 16.0, 14.0, 11.0, 9.0]
Freq_MHz Output2_dB
Used python 3.7
Create as a starting point for ideas
Use at your own risk.