Presentation on Gaussian and LabVIEW® 3D Surface graph and Intensity Graph
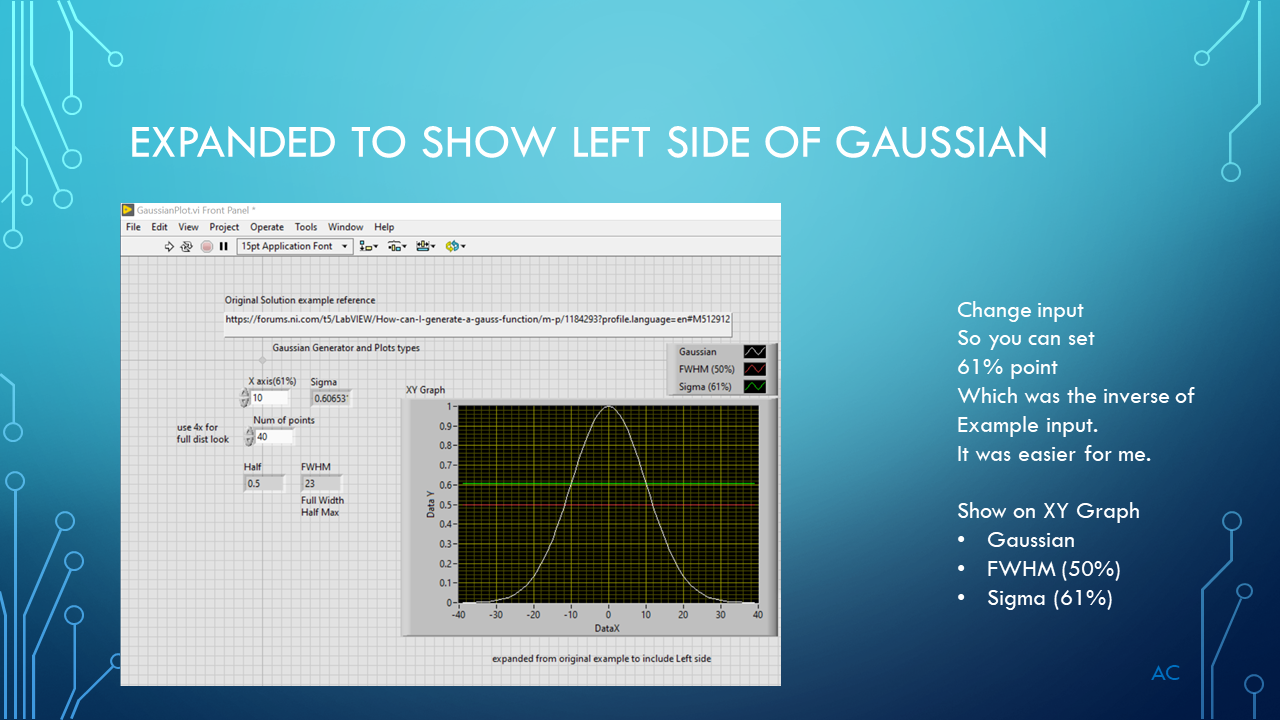
Starting example/reference for the Gaussian function (Right side):
https://forums.ni.com/t5/LabVIEW/How-can-I-generate-a-gauss-function/m-p/1184293#M512912


Added jan/28/2026
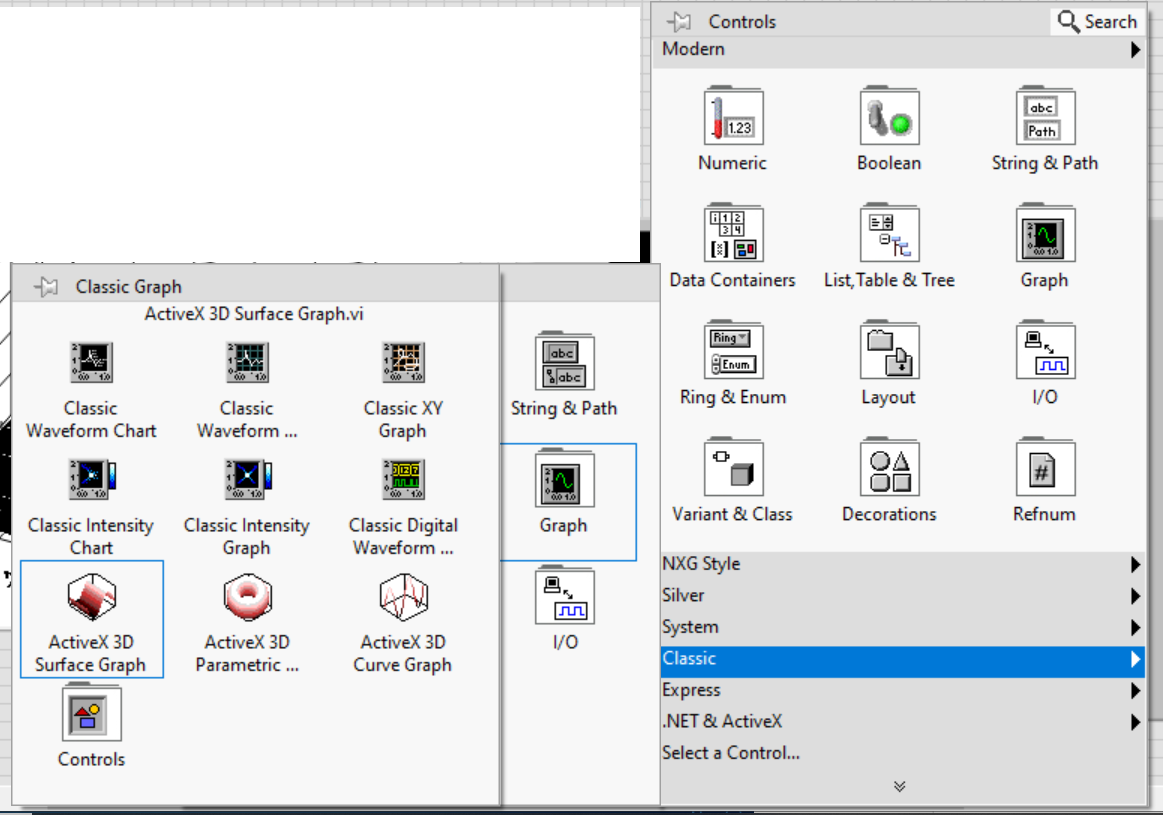
Where is 3D Surface vi in the controls
Classic- Graph-ActiveX_3D surface Graph