
Sinewave fit function from python script called via LabVIEW
Presentation
Code
Zip
Image

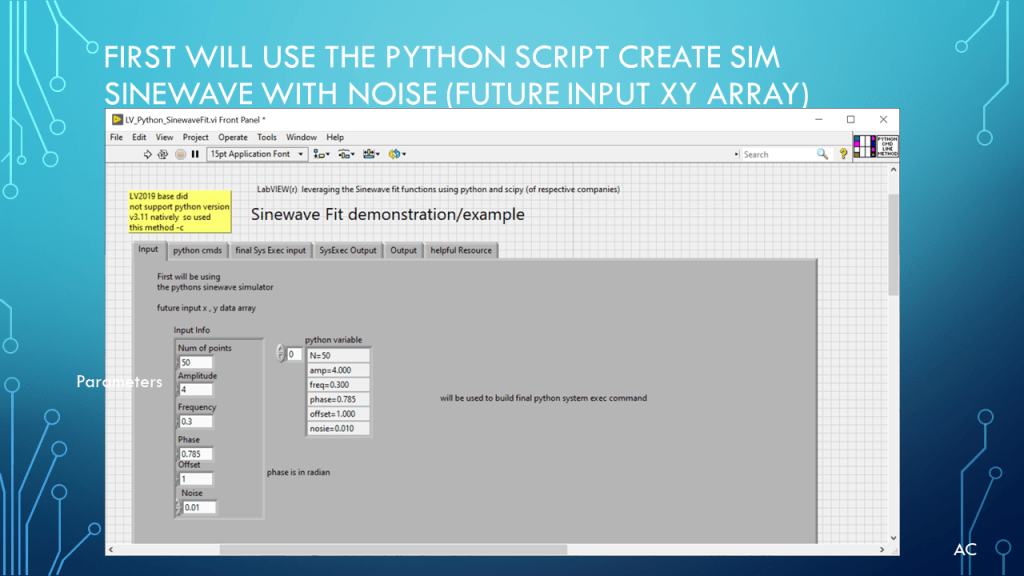
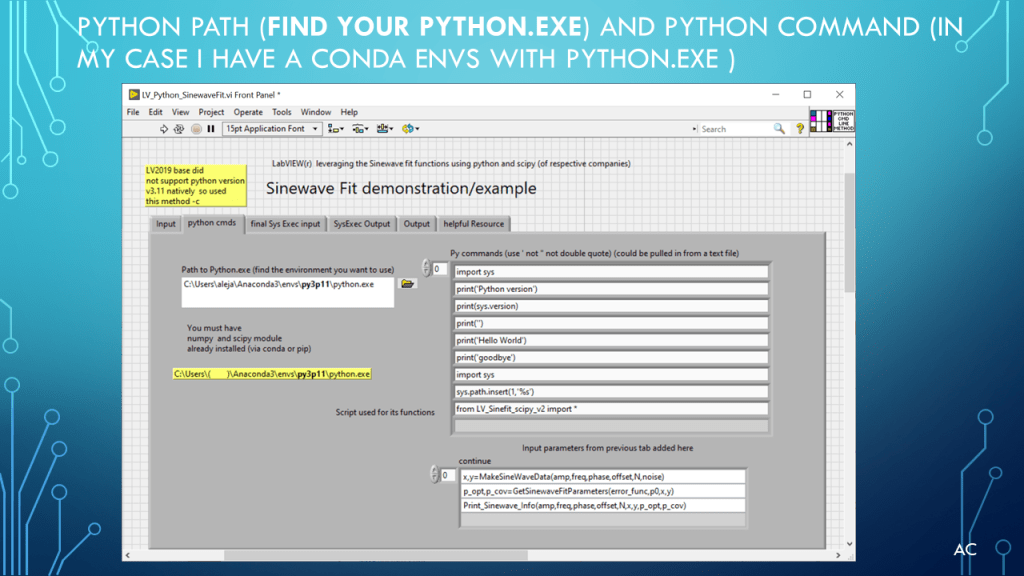
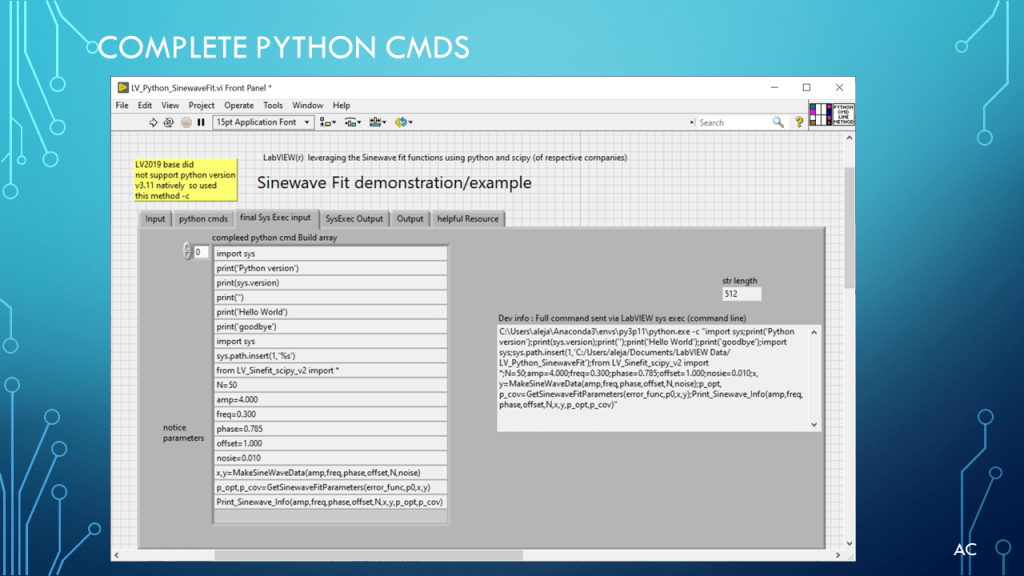
python script
# -*- coding: utf-8 -*-
"""
Created on Tue Oct 31 06:38:35 2023
@author: aleja
"""
#MODIFIED For use by LabVIEW (see previous blog for python only)
#Testing out code form Bing Chat as starting point
#some modification added for clarity,and testing
# Generate some sample data
import numpy as np
#import matplotlib.pyplot as plt
N = 20 # number of data points
amp = 2.0 # amplitude of the sinewave
freq = 0.2 # frequency of the sinewave
phase = np.pi / 4 # phase of the sinewave
offset = 1.0 # offset of the sinewave
noise = 0.01 # noise level reduce from chat was 0.5 to see lest noise at first
def MakeSineWaveData(amp,freq,phase,offset,N,noise):
#number of cycle freq * max x
# Create the x and y values
x = np.linspace(0,10, N) #changing this to test how strong this leastsq fit is
y = amp * np.sin(2 * np.pi * freq * x + phase) + offset
y += noise * np.random.randn(N) # add some noise
print("===x===")
#print(x)
print(np.array2string(x, separator=',',formatter={'float_kind':lambda x: "%.3f" % x}))
print("===End===")
#print(y)
print("===y===")
print(np.array2string(y, separator=',',formatter={'float_kind':lambda x: "%.3f" % x}))
print("===End===")
return x,y
# #Test function here
#x,y=MakeSineWaveData(amp,freq,phase,offset,N,noise)
# # Plot the data
# plt.scatter(x, y)
# plt.xlabel("x-voltage")
# plt.ylabel("y-optical detector")
# plt.title("Sample data-fictional")
# plt.show()
#Next Fit testing out chat code
# Fit a sinewave using least squares optimization
from scipy.optimize import leastsq
# Define the sinewave function
def sin_func(p, x):
A, f, p, c = p # unpack the parameters
return A * np.sin(2 * np.pi * f * x + p) + c
# Define the error function to minimize
def error_func(p, x, y):
return y - sin_func(p, x)
# Make some initial guesses for the parameters
p0 = [amp, freq, phase, offset]
def GetSinewaveFitParameters(error_func,p0,x,y):
# Optimize the parameters using least squares
p_opt, p_cov = leastsq(error_func, p0, args=(x,y))
return p_opt,p_cov
# #test function here
# p_opt,p_cov=GetSinewaveFitParameters(error_func,p0,x,y)
# X = np.linspace(0, 10, N*10) #new x for better visual of sinewave
# # Predict the y values using the optimized parameters
# y_pred = sin_func(p_opt,X)
# # Plot the inputdata(blue dots) and predicted curves(red line)
# plt.plot(x,y,"b.",label="data")
# plt.plot(X,y_pred,"r-",label="prediction")
# plt.xlabel("x-voltage")
# plt.ylabel("y-optical detector")
# plt.title("Sinewave fitting using least squares-not real product data")
# plt.legend()
# plt.show()
def Print_Sinewave_Info(amp,freq,phase,offset,N,x,y,p_opt,p_cov):
#added print for simulation info
#print will go to console (spyder or Labview stdout)
print("===Simulated Paramters:===") #===section=== format need for LV extraction
print(f"Number of Points: {N}")
print(f"Number of cycles {freq*np.max(x):.1f}")
print(f"Amplitude: {amp:.3f}")
print(f"Frequency: {freq:.3f}")
print(f"Phase: {phase:.3f}")
print(f"Offset: {offset:.3f}")
print(f"Noise: {noise:.3f}")
print("===End===")
print("\n")
# Print the optimized parameters
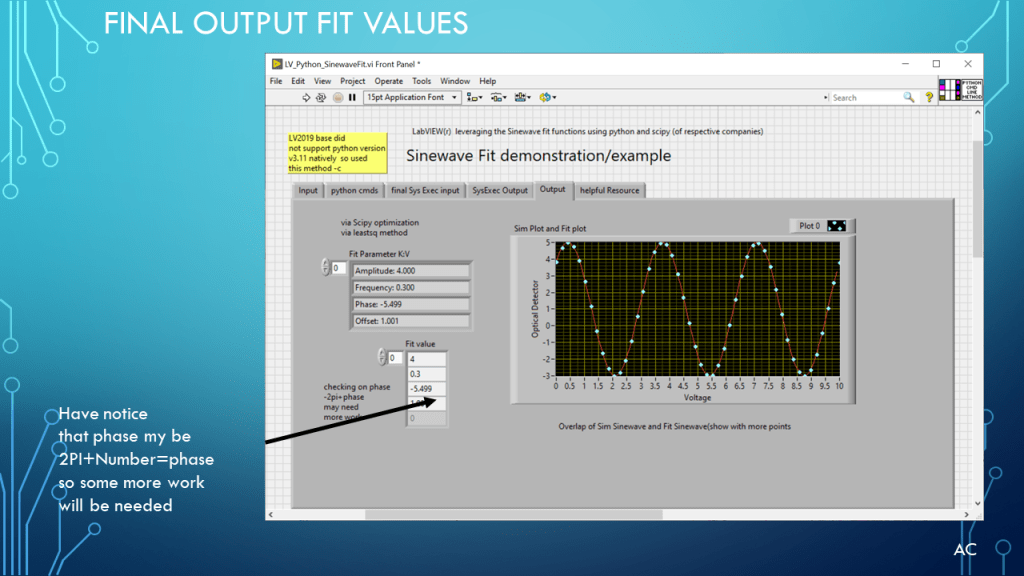
print("===Fit Parameters:===")
print(f"Amplitude: {p_opt[0]:.3f}")
print(f"Frequency: {p_opt[1]:.3f}")
print(f"Phase: {p_opt[2]:.3f}")
print(f"Offset: {p_opt[3]:.3f}")
print("===End===")
print("\n")
# #Test out function
#Print_Sinewave_Info(amp,freq,phase,offset,N,x,y,p_opt,p_cov)
#added comments below not part of Chat info
#summary: Chat created code was workable, added print to compare sim and fit
#opinion: does a good job at fitting sinewave ...see presentation
#opinion: best when provide with more points over cycle (most know this)
#see blog presentation at www.testengineerresource.com
#Environment used: python 3.11.3 and worked in Spyder IDE 5.4.3 (conda), mathplotlib 3.7.1
#Environment info: I have plot show in own window (not in Spyder)
#Plots are not clear to allow for testing of overlap sinewave fit.
#getting version info
#import matplotlib
#print ('matplotlib: {}'.format (matplotlib.__version__))
Notes
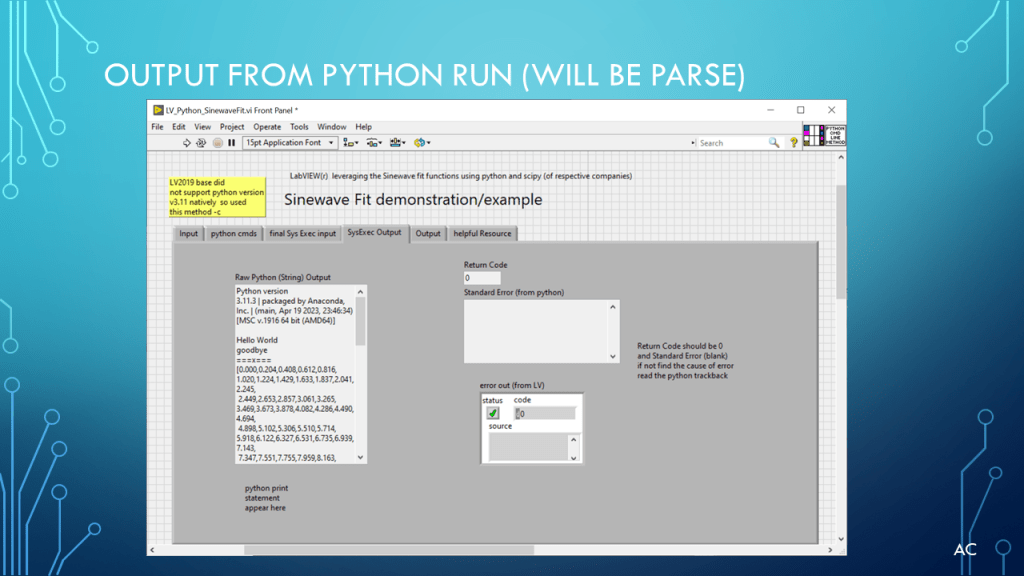
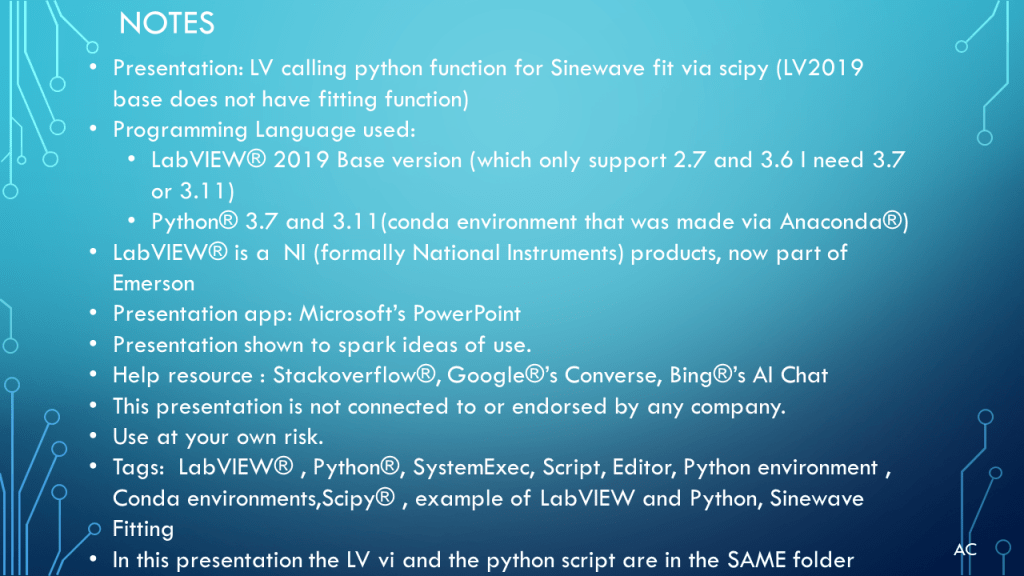
- Presentation: LV calling python function for Sinewave fit via scipy (LV2019 base does not have fitting function)
- Programming Language used:
- LabVIEW® 2019 Base version (which only support 2.7 and 3.6 I need 3.7 or 3.11)
- Python® 3.7 and 3.11(conda environment that was made via Anaconda®)
- LabVIEW® is a NI (formally National Instruments) products, now part of Emerson
- Presentation app: Microsoft’s PowerPoint
- Presentation shown to spark ideas of use.
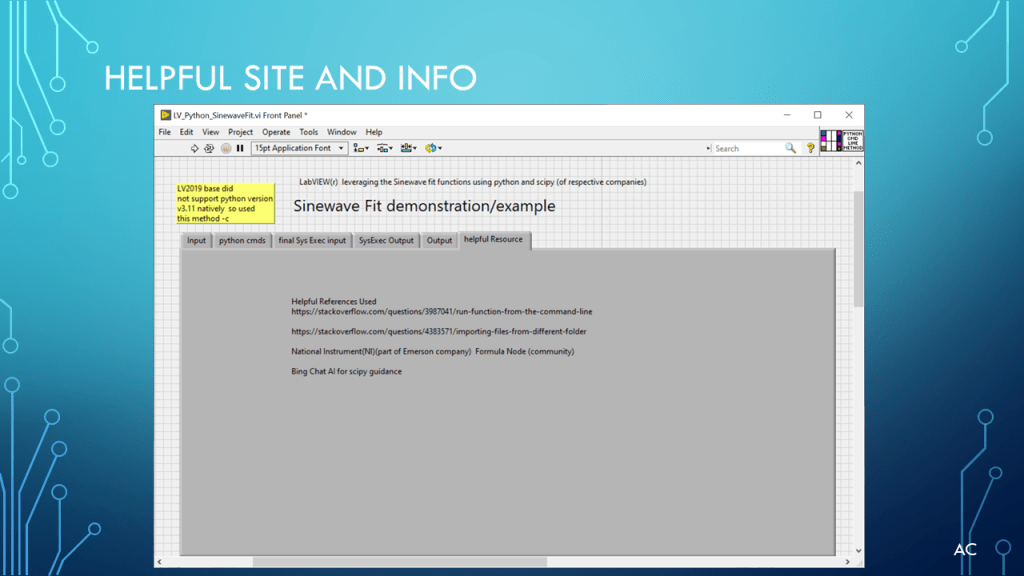
- Help resource : Stackoverflow®, Google®’s Converse, Bing®’s AI Chat
- This presentation is not connected to or endorsed by any company.
- Use at your own risk.
- Tags: LabVIEW® , Python®, SystemExec, Script, Editor, Python environment , Conda environments,Scipy® , example of LabVIEW and Python, Sinewave Fitting
- In this presentation the LV vi and the python script are in the SAME folder
