Test Engineers Resource
Requirements-Design-Develope-Test-Deploy
Skip to content
Home
About
Other Posts
Quick Links
←
Creating Clusters from the FP LV2019
Type Specialization Structure and VIM
→
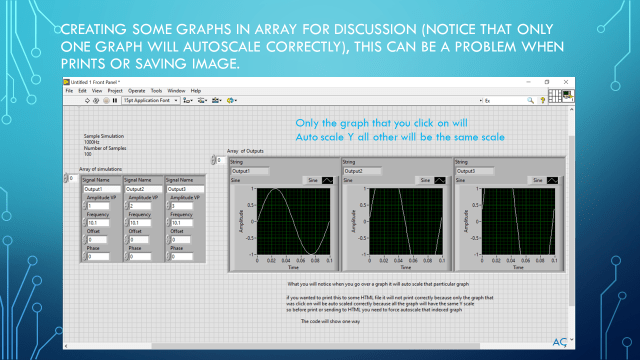
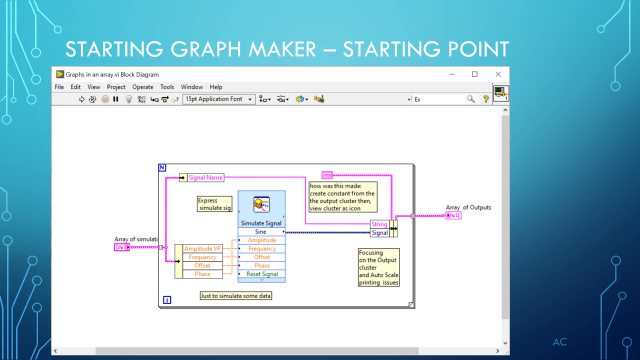
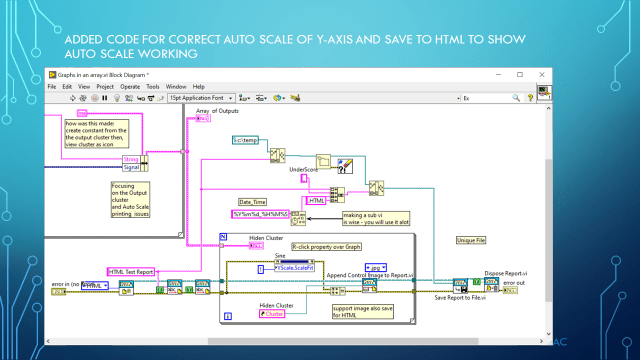
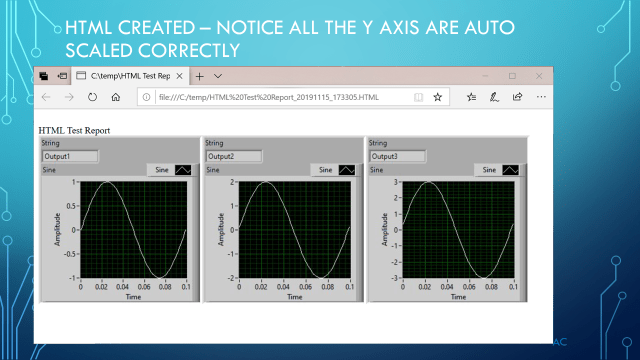
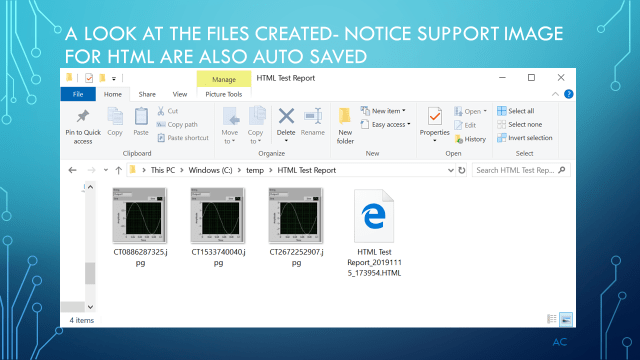
Working with Array of Cluster with Graph- the auto scale discussion
Posted on
November 15, 2019
by
LV_TS_Test_Engineer_3000_VI
Discussion on working with Graph inside an array of cluster.
Share this:
Share on Facebook (Opens in new window)
Facebook
Share on X (Opens in new window)
X
Like
Loading...
Related
About LV_TS_Test_Engineer_3000_VI
Automated Test Equipment Software
View all posts by LV_TS_Test_Engineer_3000_VI
→
This entry was posted in
Test Sector
and tagged
Autoscale
,
Graph
,
HTML test report
,
LabVIEW
. Bookmark the
permalink
.
←
Creating Clusters from the FP LV2019
Type Specialization Structure and VIM
→
Leave a comment
Cancel reply
Δ
Search for:
Recent Posts
Two Close Two PI
Python – Sklearn – Chi- Categorical Ordinal
My Mississippi Harmonica Co Regal Model 96235
Python – FTT – with Scipy
LabVIEW(r) , Python(r) Sinewave Fit
Sinewave Fit via Python with SciPy
LV- Event Queue and fun with Pict function
LV Timed Loop Structure – OFFSET
Arduino PID with Motor, Ultrasonic Sensor, and a paper basket type coffee filter
Using Arduino and BB’s PID with Simple LED Brightness setup to Learn PID
Python-A way to show digital patterns(bits) in Matplotlib
Python – A version of Producer Consumer Pattern with Queues and Threading – Simulated Temp Chamber Demo
InProcess: Python – A version of Producer Consumer Pattern
Tkinter GUI and (non-tk) Matplotlib shrinking the tk GUI
Python – Sequence Editor example
Python – Analog Meter with New Chart-Class this time
Python tkinter and time delay
Python – MCC USB-1208FS-Plus
Python – Learn Queue GUI
Python – Analog Meter GUI example
Categories
Actor Framework
Arduino(r)
Array-2D
Enum
Excel
Graph
Harmonica
LabVIEW(r)
Matplotlib
MCC_USB_1208FS_Plus
multicolumn ListBox
Multiple Slider
music
Picture-Paict
Python
Queue
SciPy
Slider
Tabs
Test Sector
tkinter
Uncategorized
Waveform Chart
XY Grpah
Meta
Create account
Log in
Entries feed
Comments feed
WordPress.com
Comment
Reblog
Subscribe
Subscribed
Test Engineers Resource
Sign me up
Already have a WordPress.com account?
Log in now.
Test Engineers Resource
Subscribe
Subscribed
Sign up
Log in
Copy shortlink
Report this content
View post in Reader
Manage subscriptions
Collapse this bar
Loading Comments...
Write a Comment...
Email (Required)
Name (Required)
Website
%d